# Required packages
library(GJRM)
library(ggplot2)
library(dplyr)
library(maps)

# Semi-parametric bivariate Gaussian copula model
# outSP <- gjrm(
#   list(
#     iCert ~ ChecAndORSavAccOwnshp + OverDraftFacility + LineCredORLoanFinInst +
#               PeriodPostCovid + DigitStratg2 + extAudit + legalStat +
#               size + sector_MS + largFirm + AccsToFinObstOP +
#               TranspObstOP + PolCorupt +
#               s(nyearsOper) + s(MangYrExpSect) + s(region) + s(PercSenManTimGovReg),
#     logSales ~ ChecAndORSavAccOwnshp + OverDraftFacility + LineCredORLoanFinInst +
#               PeriodPostCovid + DigitStratg2 + extAudit + legalStat +
#               size + sector_MS + largFirm + femOwner + logLabCost +
#               AccsToFinObstOP + TranspObstOP + PolCorupt +
#               s(nyearsOper) + s(MangYrExpSect) + s(region)
#   ),
#   data = wbes_data,
#   Model = "BSS",
#   BivD = "N",
#   margins = c("probit", "N")
# )Financial Inclusion Effects on Firms’ Quality Certification and Sales Performance
Digitalization Inclusion and Development
Examines how formal financial inclusion, digital strategies, and international quality certification jointly influence firm sales performance using data from 96,952 firms across 148 countries (World Bank Enterprise Survey, 2006–2023). A semi-parametric bivariate Gaussian copula model reveals that financial inclusion boosts certification likelihood by up to 14.3% and raises sales by up to 48% among certified manufacturing firms, while female-owned enterprises face an 8.1% sales penalty. Digital adoption amplifies these gains, with combined website and email strategies yielding a 209.7% sales increase.
Abstract
This paper examines how formal financial inclusion, digital strategies, and international quality certification jointly influence firm sales performance using data from 96,952 firms across 148 countries in the World Bank Enterprise Survey (2006–2023). Drawing on signaling theory and the resource-based view, we apply a semi-parametric bivariate Gaussian copula model to capture endogeneity and non-linear relationships between certification and log sales. Results indicate that financial inclusion—via accounts, overdrafts, and credit lines—increases the probability of certification by 14.3% and raises sales by up to 48% among certified manufacturing firms, with digital adoption further strengthening these effects. Larger and manufacturing firms benefit more, whereas female-owned enterprises experience an 8.1% sales penalty, reflecting persistent inclusivity challenges. Regional differences highlight South Asia and Europe–Central Asia as leaders, supported by stronger digital infrastructure. A 10.4% post-COVID sales decline underscores the urgency of financial access and digitalization policies for SME competitiveness and sustainable global integration.
Keywords: Financial Inclusion, Digital Strategy, Quality Certification, Sales Performance, Gaussian Copula, Signaling Theory
JEL Classification: O33, Q52, L15, G21
1. Introduction
The global economy is undergoing a profound transformation, propelled by digitalization and financial inclusion, which are redefining competitive dynamics for firms in services and manufacturing sectors (Chauvet & Jacolin, 2017; Mayer, 2021). Digital technologies—such as websites, mobile apps, and fintech platforms—enhance market access, operational efficiency, and firm resilience, while access to formal financial services empowers firms to invest in these innovations and international quality certifications (e.g., ISO 9001, ISO 14001) to signal credibility and secure competitive advantage (Alshahrani & Husain, 2023; Niankara, 2024; Pang et al., 2024). However, the interplay between formal financial inclusion, digital strategies, and quality certifications remains a critical yet underexplored enabler of firm performance, particularly for small and medium-sized enterprises (SMEs) in diverse global contexts (He et al., 2025; Koutroumpis & Sarri, 2024). Despite evidence that financial inclusion drives SME growth by facilitating investments in technology and market expansion (Chauvet & Jacolin, 2017; Dela Cruz et al., 2023), its synergistic effects with digitalization and certification on sales performance are insufficiently examined, especially across varied economic and regional landscapes (Jacolin et al., 2021; Vu et al., 2025).
Recent studies underscore digitalization’s economic impacts, from broadband access boosting small firm productivity (Koutroumpis & Sarri, 2024) to digital connectedness enhancing export complexity in sub-Saharan Africa (Cariolle & Piedade, 2023). Others highlight digital trade rules as catalysts for global value chain (GVC) service trade (Wu et al., 2023) and data governance as a driver of new industrialization strategies (Mayer, 2021). Yet, these studies often overlook how formal financial inclusion interacts with digital strategies and quality certifications to shape firm-level outcomes, particularly sales performance. For SMEs, financial constraints critically impede the adoption of digital tools and certifications essential for global competitiveness (Calatayud & Rochina Barrachina, 2023; Dela Cruz et al., 2023; Niankara & Islam, 2023). While mobile financial services reduce informality (Jacolin et al., 2021), and digital financial inclusion enhances SME performance through fintech innovations (Al Zobi et al., 2025; Mahato & Kanth, 2025), the broader implications for quality certification and sales across services and manufacturing sectors remain underexplored. Moreover, gender disparities in financial access, particularly for women-owned firms, exacerbate these challenges, highlighting the need for inclusive financial systems to bridge performance gaps (He et al., 2025; Peter et al., 2025).
This study addresses these gaps by examining the synergistic effects of formal financial inclusion, digital strategies, and international quality certifications on sales performance across 96,952 firms in 148 countries, as visualized in Figure 2. Grounded in signaling theory (Connelly et al., 2011), we propose that financial inclusion serves as a credible signal of firm reliability, complementing quality certifications to reduce information asymmetry and enhance stakeholder trust (Bose et al., 2017). From a resource-based view (He et al., 2025; Heredia et al., 2022), access to finance provides critical resources to build digital capabilities and quality management systems, amplifying competitive advantage (Bhattacharyya & Khan, 2023). Extending Niankara (2024), we employ a semi-parametric bivariate Gaussian copula model (Becker et al., 2022) to capture non-linear relationships and address endogeneity, offering a robust framework to answer the following questions:
- How does formal financial inclusion enhance the likelihood of obtaining international quality certifications?
- What are the direct and indirect effects of financial inclusion on firms’ sales performance, including mediating roles of digital strategies and certifications?
- How do financial inclusion, digital strategy, and quality certification interact to shape sales outcomes in services versus manufacturing firms?
- What roles do firm characteristics (e.g., size, female ownership) and regional factors play in mediating these relationships?
Our findings reveal that formal financial inclusion boosts certification likelihood by up to 14.3% and drives a 48% sales surge for certified manufacturing firms, with stronger effects in regions with robust digital infrastructure, such as South Asia and Europe and Central Asia (Demirgüç-Kunt et al., 2019; Pang et al., 2024). Digital financial inclusion, including fintech solutions, amplifies these gains, particularly for SMEs (Al Zobi et al., 2025; Mahato & Kanth, 2025), while female-owned firms face an 8.1% sales penalty, underscoring persistent inclusivity gaps (Peter et al., 2025). These results align with the extent literature’s focus on digitalization and trade (Suh & Roh, 2023; Wu et al., 2023) and complement evidence that financial inclusion enhances firm growth in developing economies (Chauvet & Jacolin, 2017; Vu et al., 2025). By leveraging a global dataset and advanced econometrics, this study provides policymakers with a blueprint for fostering inclusive financial systems and digital adoption to enhance SME competitiveness, reduce gender disparities, and promote global market integration, aligning with sustainable development goals (Bhattacharyya & Khan, 2023; Dela Cruz et al., 2023).
The remainder of the article is structured as follows: Section 2 reviews the literature. Section 3 details the methodology. Section 4 presents descriptive findings. Section 5 reports econometric results. Section 6 discusses the findings. Section 7 outlines policy implications. Section 8 concludes.
2. Literature Review
2.1 Digital Strategy and Quality Certification
Digital strategies, encompassing tools such as website ownership, e-commerce platforms, and digital marketing, are pivotal for enhancing firm visibility, market reach, and operational efficiency in the global economy (Pang et al., 2024; Shah et al., 2024; Wysokińska, 2021). Niankara (2024) employed a semi-parametric Gumbel copula model to demonstrate that firms adopting digital strategies, particularly website ownership, achieve 43% higher sales performance globally, with quality certifications amplifying this effect. This aligns with Bhandari et al. (2023), who argue that digitalization fosters internationalization by enabling firms to orchestrate resources effectively, creating new organizational, location, and internalization (OLI) advantages. Heredia et al. (2022) further emphasize the mediating role of technological capabilities in linking digital strategies to firm performance, underscoring the need for digital organizational cultures (Martinez-Caro et al., 2020). In the context of ICT firms, Vu et al. (2025) highlight that digital financial inclusion enhances sales but may reduce return on assets, suggesting nuanced performance outcomes when digital strategies are integrated with financial access.
International quality certifications, such as ISO 9001 and ISO 14001, serve as credible signals of quality, reducing information asymmetry and enhancing stakeholder trust (Bose et al., 2017; Connelly et al., 2011; Ullah, 2020). Ballina et al. (2020) apply signaling theory to show that quality standards in the hospitality sector improve performance by signaling reliability to customers. Alshahrani & Husain (2023) report that ISO 9001 implementation boosts SME performance in emerging economies by enhancing process efficiency and customer satisfaction, a finding corroborated by Nurcahyo et al. (2021) among 50 automotive component manufacturing firms in Indonesia. Conversely, Hadidi et al. (2017) caution that ISO 9001 does not always guarantee higher customer satisfaction, advocating gap analysis to identify improvement areas. Astrini (2018) note that certification benefits vary by firm size, industry, and implementation rigor, with larger firms often gaining more due to superior resources (Barbosa et al., 2023). Bhattacharyya & Khan (2023) extend this by linking quality certifications to corporate social responsibility, suggesting that certifications signal broader stakeholder commitment, enhancing market-based performance.
The synergy between digital strategies and quality certifications creates significant performance enhancements. Azzaoui et al. (2023) demonstrate that combining digitalization with quality tools in automotive manufacturing improves process reliability and firm performance. Lepistö et al. (2022) argue that total quality management (TQM), when supported by digitalization, boosts SME profitability through risk management and stakeholder engagement. Pang et al. (2024) further show that digital financial inclusion and information and communication technologies (ICT) amplify firm performance in China, particularly for non-state-owned enterprises at higher performance quantiles. Despite these insights, the literature lacks comprehensive studies on how digital strategies and quality certifications interact across services and manufacturing sectors in the context of formal financial inclusion, a gap this study addresses by integrating global evidence and advanced econometric methods (Dela Cruz et al., 2023).
2.2 Financial Inclusion and Firm Performance
Financial inclusion, defined as access to and use of formal financial services such as banking, credit, and insurance, is a critical enabler of firm growth and competitiveness (Chauvet & Jacolin, 2017; Demirguc-Kunt et al., 2018; Niankara & Islam, 2023). Demirguc-Kunt et al. (2018) demonstrate that access to finance enables investments in technology, quality systems, and market expansion, significantly boosting productivity in developing economies. Asongu (2020) find that credit access enhances firm productivity in Sub-Saharan Africa, a finding echoed by Calatayud & Rochina Barrachina (2023), who note that financial access facilitates global value chain participation, improving innovation and employment outcomes. Chauvet & Jacolin (2017) confirm this across 55,596 firms in 79 countries, showing that financial inclusion drives firm growth, with effects magnified by bank competition. He et al. (2025) further highlight that credit access reduces performance disparities among Chinese MSMEs, particularly for geographically and educationally disadvantaged firms, aligning with the resource-based view (Heredia et al., 2022).
Digital financial inclusion, driven by fintech and digital payment systems, has emerged as a transformative force (Al Zobi et al., 2025; Mahato & Kanth, 2025; Minarni, 2025; Mpofu & Mpofu, 2024). Niankara & Traoret (2023) report that digital payment adoption during the COVID-19 pandemic increased formal financial inclusion, enhancing firm resilience. Alshareef & Tunio (2022) find that digital financial intermediation, including blockchain, improves SME performance in Saudi Arabia by enhancing transparency and efficiency. Peter et al. (2025) demonstrate that digital financial literacy significantly enhances financial inclusion for women entrepreneurs in India, partially mediating firm performance, though financial behavior may negatively moderate this relationship. Similarly, Mahato & Kanth (2025) show that digital financial inclusion improves Indian family firm performance, with financial well-being as a key mediator. However, Vu et al. (2025) caution that while financial inclusion increases corporate borrowings in Vietnamese ICT firms, it may reduce return on assets due to increased leverage, highlighting complex performance dynamics. Fersi et al. (2023) note that digital transformation in microfinance institutions may reduce operational efficiency due to high initial costs, though it expands social outreach.
Despite these advancements, the mediating role of financial inclusion in the quality certification–sales performance nexus remains underexplored (Dela Cruz et al., 2023). Bose et al. (2017) find that financial inclusion disclosure enhances bank performance in Bangladesh, reducing information asymmetry and increasing market share, supporting signaling theory. Bhattacharyya & Khan (2023) reveal a positive but complex relationship between financial inclusion and firm performance, moderated by corporate social responsibility. Lashitew (2014) note that credit access in less financially developed economies is often politically influenced, skewing benefits toward connected firms. Zaki (2024) identify access to finance as a key constraint for Egyptian SMEs, while Williams et al. (2025) emphasize bridging credit gaps and boosting digitalization to unlock SME potential in Sub-Saharan Africa.
3. Methodology
3.1 Theoretical Framework
This study integrates signaling theory and the resource-based view (RBV) to conceptualize the relationships among financial inclusion, quality certification, digital strategy, and sales performance. Signaling theory posits that firms undertake costly actions, such as obtaining quality certifications or adopting financial services, to signal reliability and reduce information asymmetry (Connelly et al., 2011; Moratis, 2018; Ullah, 2020). Quality certifications like ISO 9001 and ISO 14001 signal a firm’s ability to meet international standards, enhancing stakeholder trust and market competitiveness (Sharma & Klein, 2025; Terlaak & King, 2006; Wayoro et al., 2025). Financial inclusion, by enabling access to formal financial services, serves as a complementary signal of financial stability and capital for quality investments (Niankara & Islam, 2023). Ballina et al. (2020) argue that such signals are particularly effective in high-trust environments, where stakeholders value transparency and reliability.
The RBV complements signaling theory by emphasizing that sustained competitive advantage derives from unique, valuable, and hard-to-replicate capabilities (Heubeck, 2023; Lo Bue & Martínez-Zarzoso, 2024). Access to financial resources enables firms to invest in digital capabilities and quality management systems, creating competitive advantages (Khin & Ho, 2018; Ma & Gu, 2024). Heredia et al. (2022) demonstrate that digital capabilities mediate the relationship between financial resources and firm performance, while Liu et al. (2023) highlight the affordance perspective, suggesting that digital technologies enable firms to exploit opportunities in dynamic markets. Bansal et al. (2025) argue that digital financial inclusion fosters sustainable development by providing firms with the resources to pursue innovative strategies, aligning with RBV principles.
The integration of these frameworks addresses a critical gap in the literature. While Niankara (2024) applies signaling theory to the digital strategy–certification nexus, the role of financial inclusion as a signal and resource remains underexplored. Lo Bue & Martínez-Zarzoso (2024) suggest that female-managed firms face greater financial constraints, indicating that financial inclusion may have heterogeneous effects by ownership structure. Munodawafa et al. (2024) emphasize the importance of financial management skills in sustaining SME growth, suggesting that financial inclusion’s impact depends on firms’ absorptive capacity.
3.2 Conceptual Framework
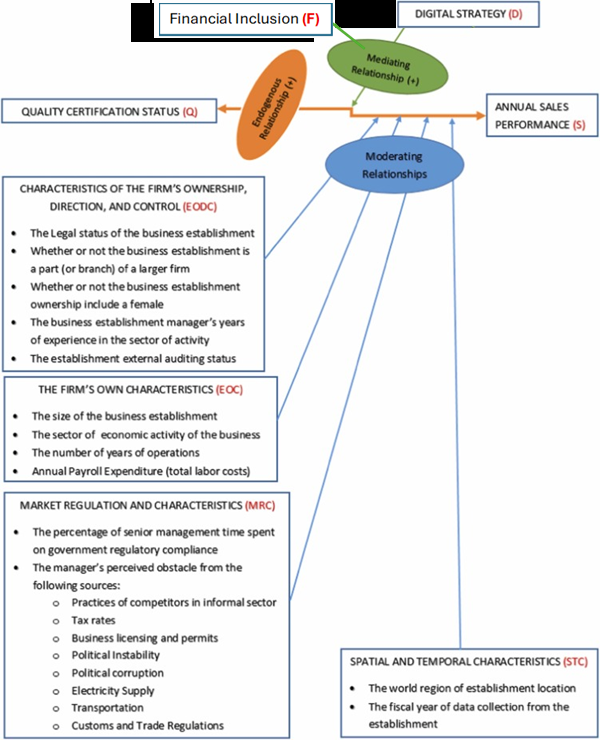
The adopted conceptual framework extends the one presented in Niankara (2024) by incorporating financial inclusion as a mediating variable. Figure 1 illustrates the hypothesized relationships among financial inclusion (F), digital strategy (D), quality certification (Q), and sales performance (S).
3.3 The Data
This study adopts a cross-sectional panel design, leveraging secondary data from the World Bank Enterprise Survey (WBES) database, updated as of July 17, 2024 (World Bank Enterprise Survey, 2022a). The WBES, conducted in collaboration with national statistical offices and business associations in emerging markets and developing economies, collects firm-level data on business environment, performance, and characteristics through face-to-face interviews with business owners or top managers (World Bank Enterprise Survey, 2022b). The survey employs a standardized core questionnaire and stratified random sampling (stratified by firm size, sector, and region), ensuring comparability across countries and over time.
The cross-national/regional coverage of the data sample is mapped in Figure 2.
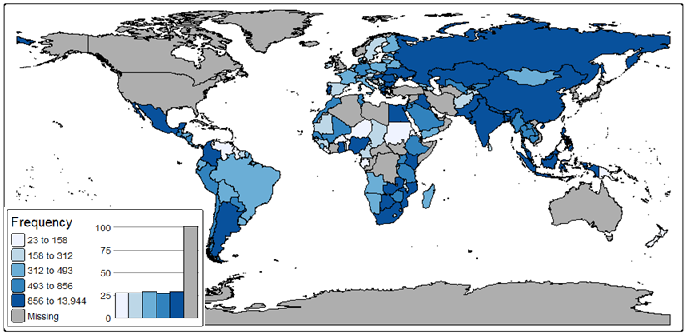
The dataset comprises 96,952 firms from 148 economies, covering fiscal years 2006–2023, with data segmented into Pre-COVID (2006–2019, n=56,667) and Post-COVID (2020–2023, n=40,285) periods to capture temporal economic shifts. The sample includes manufacturing (53.6%, n=51,983) and services (46.4%, n=44,969) firms, with firm sizes distributed as small (5–19 employees, 49.1%, n=47,634), medium (20–99 employees, 33.2%, n=32,157), and large (100+ employees, 17.7%, n=17,161). The sample spans six regions: Europe and Central Asia (24.2%, n=23,478), Africa (21.3%, n=20,611), East Asia and Pacific (11.6%, n=11,206), Latin America and Caribbean (13.7%, n=13,312), Middle East and North Africa (9.9%, n=9,641), and South Asia (19.3%, n=18,704).
3.4 Operational Definitions of Variables
The study operationalizes variables to investigate the interplay of financial inclusion, digital strategy, and quality certification on sales performance, grounded in signaling theory and the resource-based view (RBV). Table 1 provides a summary of variable definitions.
Table 1: Definition of Analysis Variables
| Variable | Description |
|---|---|
| Dependent Variables | |
| logSales | Natural log of total annual sales revenue, measuring sales performance. |
| iCert | Binary indicator of international quality certification status (1 = certified; 0 = otherwise). |
| Financial Inclusion Variables | |
| ChecAndORSavAccOwnshp | Binary indicator of checking or savings account ownership (1 = yes; 0 = otherwise). |
| OverDraftFacility | Binary indicator of access to an overdraft facility (1 = yes; 0 = otherwise). |
| LineCredORLoanFinInst | Binary indicator of access to a line of credit or loan from a financial institution (1 = yes; 0 = otherwise). |
| Digital Strategy Variable | |
| DigitStratg2 | Categorical variable: None, WebsiteOnly, EmailComly, WebsEmailCom. |
| Firm Characteristics | |
| extAudit | Binary indicator of external auditing in the last fiscal year (1 = audited; 0 = otherwise). |
| nyearsOper | Number of years the firm has been in operation. |
| legalStat | Legal status: Shareholding (publicly traded), Shareholding (non-/privately traded), Sole proprietorship, Partnership, Limited partnership, Other. |
| size | Firm size: Small (5–19 employees), Medium (20–99), Large (100+). |
| sector_MS | Binary indicator of sector (1 = Services; 0 = Manufacturing). |
| largFirm | Binary indicator of whether the firm is part of a larger firm (1 = yes). |
| femOwner | Binary indicator of female ownership (1 = yes). |
| MangYrExpSect | Years of manager’s experience in the firm’s sector. |
| Market Conditions | |
| PercSenManTimGovReg | % of senior management time spent on regulatory compliance. |
| AccsToFinObstOP | Perceived obstacle from access to finance (0 = None; 4 = High). |
| PraCompInfSec | Perceived obstacle from informal sector competition (0–4). |
| TaxRates | Perceived obstacle from tax rates (0–4). |
| TranspObstOP | Perceived obstacle from transportation (0–5). |
| PolInstab | Perceived obstacle from political instability (0–4). |
| PolCorupt | Perceived obstacle from political corruption (0–4). |
| Spatio-Temporal Variables | |
| region | World region: Europe & Central Asia, Africa, East Asia & Pacific, Latin America & Caribbean, MENA, South Asia. |
| Period | PreCovid (2006–2019) or PostCovid (2020–2023). |
3.5 Econometric Model Specification
To address potential endogeneity of quality certification, the study employs a semi-parametric bivariate Gaussian copula model jointly estimating quality certification (Q) and sales performance (S), incorporating financial inclusion (F) and digital strategy (D) as key predictors, with control variables (X_i). The model is specified as a system of two equations:
Quality Certification Model:
Q_t^* = \gamma_0 + \gamma_1 D_t + \gamma_2 F_t + \gamma_3 (D_t \times F_t) + \sum_{i=4}^N \gamma_i X_{i,t} + \epsilon_{Q,t}, \quad Q_t = 1 \text{ if } Q_t^* > 0, \text{ else } 0
where Q_t^* is the latent propensity for quality certification, modeled with a probit link, and \epsilon_{Q,t} \sim N(0,1).
Sales Performance Model:
S_t = \beta_0 + \beta_1 Q_t + \beta_2 D_t + \beta_3 F_t + \beta_4 (Q_t \times D_t) + \beta_5 (Q_t \times F_t) + \beta_6 (D_t \times F_t) + \sum_{i=7}^N \beta_i X_{i,t} + \epsilon_{S,t}
where S_t = \log(\text{Sales}_t), \epsilon_{S,t} \sim N(0, \sigma_S^2), and the error terms \epsilon_{Q,t} and \epsilon_{S,t} are correlated with dependence parameter \rho.
The joint distribution of Q_t and S_t is modeled using a Gaussian copula capturing symmetric positive dependence (Marra & Radice, 2018; Niankara, 2024):
C(u_1, u_2; \rho) = \Phi_\rho\left(\Phi^{-1}(u_1), \Phi^{-1}(u_2)\right)
where u_1 = \Phi(\eta_{Q,t}) and u_2 = \Phi(S_t/\sigma_S), \Phi is the standard normal CDF, and \Phi_\rho is the bivariate normal CDF with correlation parameter \rho (-1 < \rho < 1). The parameter \rho quantifies the linear correlation between Q_t and S_t, addressing endogeneity without requiring instrumental variables (Park & Gupta, 2012).
3.6 Endogeneity and Model Identification
The potential endogeneity of quality certification (Q_t) arises from feedback effects where sales performance may influence certification decisions (Connelly et al., 2011). The Gaussian copula approach (Becker et al., 2022; Park & Gupta, 2012) models the joint distribution of Q_t and S_t, allowing the correlation between \epsilon_{Q,t} and \epsilon_{S,t} to be directly estimated via \rho, ensuring unbiased and consistent estimates (Eckert & Franses, 2022).
For continuous covariates with potential non-linear effects (e.g., nyearsOper, MangYrExpSect), the model incorporates regression splines (Eilers & Marx, 1996):
\eta_{k,t} = \beta_{k,0} + \sum_{j} f_{k,j}(X_{j,t}) + \sum_{m} \beta_{k,m} X_{m,t}, \quad k \in \{Q, S\}
where f_{k,j} are smooth B-spline functions and X_{m,t} are linear effects for categorical covariates. Smoothing parameters are estimated via penalized maximum likelihood (Wood, 2017).
3.7 Estimation and Validation
The model is estimated using penalized maximum likelihood, maximizing:
\ell(\beta, \gamma, \rho) = \sum_{t=1}^N \bigg[ Q_t \ln \Phi(\eta_{Q,t}) + (1-Q_t) \ln (1-\Phi(\eta_{Q,t})) + \ln \phi\left(\frac{S_t - \eta_{S,t}}{\sigma_S}\right) - \ln \sigma_S + \ln c\left(\Phi(\eta_{Q,t}), \Phi\left(\frac{S_t}{\sigma_S}\right); \rho \right) \bigg]
where c is the Gaussian copula density and \phi is the normal PDF. Estimation is performed in R (version 4.3.1) using the GJRM package (version 0.2-6) (Marra & Radice, 2018), with a trust region algorithm for optimization (Klein et al., 2019). Model selection is guided by AIC and BIC (Tsao, 2024). Robustness checks include alternative copula specifications (Gumbel, Clayton180, Joe) and both fully parametric and semi-parametric specifications (Niankara, 2023).
4. Results
4.1 Descriptive Findings
Figure 3 shows that firms with both financial inclusion and quality certification exhibit the highest median sales performance, particularly in manufacturing, while firms with neither exhibit the lowest. The graphical findings corroborate the numerical t-test results in Table 2, which indicate significant differences in mean log sales across groups, with all comparisons showing statistical significance at p < 0.001.
For the comparison between “Not Certified + No Fin. Inclusion” and “Not Certified + Fin. Inclusion,” a t-value of −11.042 with 14,545 degrees of freedom indicates a highly significant difference, with firms with financial inclusion having a higher mean log sales by approximately 0.35 units (95% CI: −0.4132 to −0.2886). The comparison between “Not Certified + Fin. Inclusion” and “Certified + No Fin. Inclusion” yields t = −11.738 (df=1,327), showing that certified firms without financial inclusion have a mean log sales increase of about 1.03 units (95% CI: −1.2079 to −0.8619). Lastly, certified firms with financial inclusion exhibit a mean log sales increase of approximately 0.30 units over those without (t = −3.319, df=1,418.7, p=0.0009, 95% CI: −0.4735 to −0.1217).
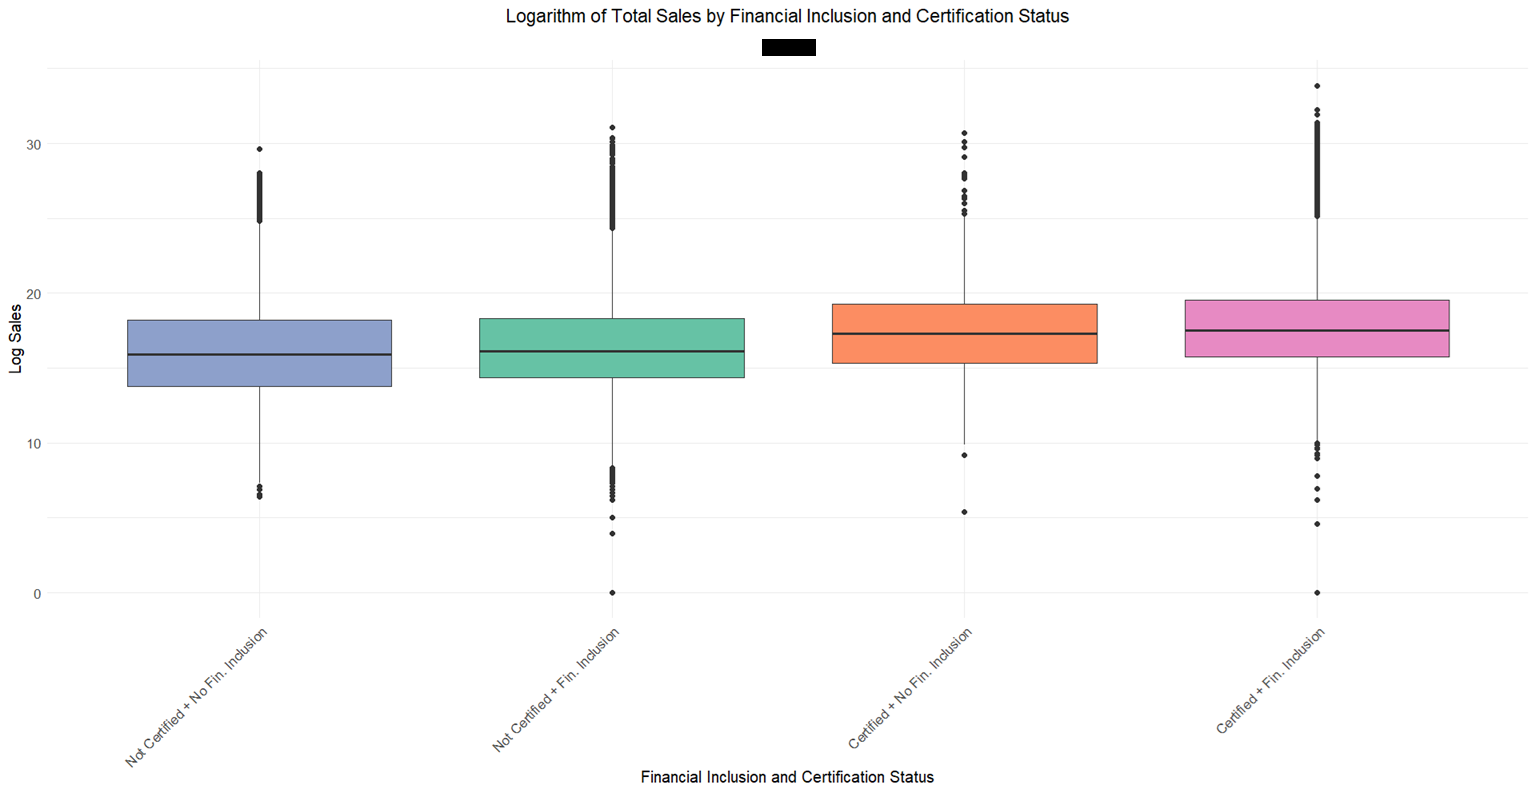
Table 2: Summary of T-Test Results for Differences in Mean Log Sales
| Comparison | t-value | df | p-value | 95% CI Lower | 95% CI Upper |
|---|---|---|---|---|---|
| Not Certified + No Fin. Inclusion vs. Not Certified + Fin. Inclusion | −11.042 | 14,545.0 | < 2.2×10⁻¹⁶ | −0.4132 | −0.2886 |
| Not Certified + Fin. Inclusion vs. Certified + No Fin. Inclusion | −11.738 | 1,327.0 | < 2.2×10⁻¹⁶ | −1.2079 | −0.8619 |
| Certified + No Fin. Inclusion vs. Certified + Fin. Inclusion | −3.319 | 1,418.7 | 0.00093 | −0.4735 | −0.1217 |
4.2 Quantitative Variables Summary Statistics
The quantitative variables in the dataset provide critical insights into 96,952 firms across 148 economies (World Bank Enterprise Survey, 2022a). Key summary statistics are presented in Table 3.
logSales (mean=16.69, SD=4.37, range: 0.00–33.85) reflects significant heterogeneity across firm sizes and sectors. logLabCost averages 14.75 (SD=4.41), with a mean difference from logSales of 1.94, supporting the resource-based view where labor resources drive performance (Helfat et al., 2023). nyearsOper averages 19.52 years (SD=14.75, range: 0–225), reflecting a predominantly established sample. MangYrExpSect averages 17.96 years (SD=11.75). PercSenManTimGovReg averages 9.91% (SD=15.87, median=2.00), indicating a right-skewed distribution of regulatory compliance burdens.
Perceived obstacles (0–4 scale) show moderate constraints: TaxRates (mean=1.64) is the highest constraint, while TranspObstOP (mean=1.14) is the lowest. PolInstab (mean=1.49) and PolCorupt (mean=1.52) indicate moderate governance challenges.
Table 3: Summary Statistics of Quantitative Variables
| Variable | N | Mean | SD | Min | Median | Max |
|---|---|---|---|---|---|---|
| logSales | 96,952 | 16.69 | 4.37 | 0.00 | 16.46 | 33.85 |
| logLabCost | 96,952 | 14.75 | 4.41 | 0.00 | 14.51 | 35.23 |
| nyearsOper | 96,952 | 19.52 | 14.75 | 0.00 | 16.00 | 225.00 |
| MangYrExpSect | 96,952 | 17.96 | 11.75 | 1.00 | 15.00 | 75.00 |
| PercSenManTimGovReg | 96,952 | 9.91 | 15.87 | 0.00 | 2.00 | 100.00 |
| AccsToFinObstOP | 96,952 | 1.33 | 1.39 | 0.00 | 1.00 | 4.00 |
| PraCompInfSec | 96,952 | 1.37 | 1.41 | 0.00 | 1.00 | 4.00 |
| TaxRates | 96,952 | 1.64 | 1.47 | 0.00 | 2.00 | 4.00 |
| TranspObstOP | 96,952 | 1.14 | 1.31 | 0.00 | 1.00 | 5.00 |
| PolInstab | 96,952 | 1.49 | 1.46 | 0.00 | 1.00 | 4.00 |
| PolCorupt | 96,952 | 1.52 | 1.47 | 0.00 | 1.00 | 4.00 |
4.3 Qualitative Variables Summary Statistics
The qualitative variables profile 96,952 firms from 148 economies (World Bank Enterprise Survey, 2022a). Key distributions are presented in Table 4.
iCert: 22,681 firms (23.4%) hold an internationally recognized quality certification, while 74,271 (76.6%) do not. Financial Inclusion: Account ownership is high (87.3%), while overdraft access (38.8%) and credit line access (22.6%) are more restricted. Digital Strategy: 34.1% of firms have no digital strategy; 28.0% use websites only; 15.7% use email only; 22.2% use both. Firm Size: 49.1% small, 33.2% medium, 17.7% large. Female Ownership: 28.6% of firms are female-owned. Region: Europe and Central Asia leads (24.2%), followed by Africa (21.3%) and South Asia (19.3%).
Table 4: Summary Statistics of Qualitative Variables
| Variable | Frequency (Percentage) |
|---|---|
| iCert | |
| Certified (1) | 22,681 (23.4%) |
| Not Certified (0) | 74,271 (76.6%) |
| ChecAndORSavAccOwnshp | |
| Yes (1) | 84,659 (87.3%) |
| No (0) | 12,293 (12.7%) |
| OverDraftFacility | |
| Yes (1) | 37,638 (38.8%) |
| No (0) | 59,314 (61.2%) |
| LineCredORLoanFinInst | |
| Yes (1) | 21,903 (22.6%) |
| No (0) | 75,049 (77.4%) |
| DigitStratg2 | |
| None | 33,078 (34.1%) |
| WebsiteOnly | 27,133 (28.0%) |
| EmailComly | 15,178 (15.7%) |
| WebsEmailCom | 21,563 (22.2%) |
| extAudit | |
| Audited (1) | 49,143 (50.7%) |
| Not Audited (0) | 47,809 (49.3%) |
| size | |
| Small (5–19 employees) | 47,634 (49.1%) |
| Medium (20–99 employees) | 32,157 (33.2%) |
| Large (100+ employees) | 17,161 (17.7%) |
| sector_MS | |
| Manufacturing (0) | 51,983 (53.6%) |
| Services (1) | 44,969 (46.4%) |
| femOwner | |
| Yes (1) | 27,705 (28.6%) |
| No (0) | 69,247 (71.4%) |
| region | |
| Europe and Central Asia | 23,478 (24.2%) |
| Africa | 20,611 (21.3%) |
| South Asia | 18,704 (19.3%) |
| Latin America and Caribbean | 13,312 (13.7%) |
| East Asia and Pacific | 11,206 (11.6%) |
| Middle East and North Africa | 9,641 (9.9%) |
| Period | |
| PreCovid (2006–2019) | 56,667 (58.4%) |
| PostCovid (2020–2023) | 40,285 (41.6%) |
5. Econometric Results
This section presents the econometric results from the fully parametric (outFP) and semi-parametric (outSP) bivariate mixed binary-continuous copula models, estimated using penalized maximum likelihood via the GJRM package in R (Marra & Radice, 2018), across 96,952 firms from 148 countries (World Bank Enterprise Survey, 2022a). The semi-parametric model’s superior fit (AIC = 156,413.7 vs. 156,495.0) justifies its use for detailed interpretation (Tsao, 2024).
5.1 Sensitivity Analysis and Model Selection
The fully parametric (outFP) and semi-parametric (outSP) models yield consistent results. Financial inclusion variables and digital strategy exhibit significant positive effects (p<0.01) in both models for both equations. The semi-parametric model’s regression splines for nyearsOper (edf=3.462–3.899, p<2\times10^{-16}), MangYrExpSect (edf=2.450–5.696, p<0.004), PercSenManTimGovReg (edf=1.000, p=0.0003, selection only), and region (edf=4.967–4.991, p<2\times10^{-16}) capture non-linear effects. The consistent dependence parameter (\theta=0.903, 95% CI: [0.897, 0.908]) across models confirms strong positive linkage between certification and sales, supporting the copula approach to address endogeneity (Park & Gupta, 2012).
Table 5: Comparative Performance of Fully Parametric and Semi-Parametric Copula Models
| Metric | Fully Parametric (outFP) | Semi-Parametric (outSP) |
|---|---|---|
| Convergence Diagnostics | ||
| Largest Absolute Gradient | 8.00×10⁻⁹ | 5.43×10⁻⁵ |
| Trust Region Iterations | 6 | 6 (pre-smoothing), 6 (within smoothing) |
| Smoothing Parameter Loops | — | 3 |
| Model Parameters | ||
| Sample Size (n) | 96,952 | 96,952 |
| Selected Certified (n.sel) | 22,681 (23.4%) | 22,681 (23.4%) |
| Sigma (95% CI) | 1.869 (1.844, 1.896) | 1.865 (1.839, 1.891) |
| Theta (95% CI) | 0.903 (0.897, 0.909) | 0.903 (0.897, 0.908) |
| Total edf | 68.000 | 79.464 |
| Model Fit | ||
| AIC | 156,495.0 | 156,413.7 |
| BIC | 157,139.8 | 157,167.2 |
5.2 Selection Equation: Quality Certification Process
The selection equation models the likelihood of firms obtaining international quality certifications using a probit link function. The intercept (−1.453, SE=0.136, z=−10.700, p<0.001) represents a low baseline certification probability of approximately 10–15% for firms with reference characteristics.
Financial Inclusion Effects on Certification: Firms with a checking or savings account (β=0.137, SE=0.019, z=7.370, p<0.001) have a 5–6% higher certification probability (Jacolin et al., 2021). Access to an overdraft facility (β=0.143, SE=0.011, z=13.591, p<0.001) increases probability by 6–7% (Niankara & Islam, 2023). A line of credit or loan (β=0.035, SE=0.012, z=2.994, p=0.003) raises probability by 1–2% (Calatayud & Rochina Barrachina, 2023).
Post-COVID Effects: The post-COVID period (β=−0.096, SE=0.019, z=−5.129, p<0.001) reduces certification probability by 3–4%, reflecting economic disruptions (Niankara & Traoret, 2023).
Digital Strategy Effects: Website-only firms (β=0.591, SE=0.016, z=36.874, p<0.001) have a 20–25% higher certification probability (Koutroumpis & Sarri, 2024). Email-only firms (β=0.217, SE=0.020, z=11.067, p<0.001) see a 7–8% increase. Combined website and email use (β=0.738, SE=0.018, z=40.590, p<0.001) yields the largest effect: 25–30% higher probability (Cariolle & Piedade, 2023; Connelly et al., 2011).
Firm Characteristics: External audits (β=0.288, p<0.001) increase probability by 10–12%. Medium-sized firms (β=0.305, p<0.001) and large firms (β=0.711, p<0.001) have 10–12% and 25–30% higher probabilities, respectively (Koutroumpis & Sarri, 2024). Service sector firms are 12–15% less likely to certify than manufacturing firms (β=−0.347, p<0.001) (Azzaoui et al., 2023). Sole proprietorships (β=−0.314, p<0.001) face a 10–12% reduction in probability (Calatayud & Rochina Barrachina, 2023). Female ownership has no significant effect on certification (β=0.002, p=0.840) (Lo Bue & Martínez-Zarzoso, 2024).
Non-Linear and Regional Effects: Years of operation (s(nyearsOper): edf=3.462, p<0.001) show diminishing returns. Regional differences (s(region): edf=4.991, p<0.001) indicate South Asia and Europe and Central Asia as leaders (Demirgüç-Kunt et al., 2019). Regulatory burden (s(PercSenManTimGovReg): edf=1.000, p<0.001) linearly reduces certification likelihood.
5.3 Outcome Equation: Sales Performance Process
The outcome equation models log sales using a Gaussian identity link. The average log sales is estimated at 13.2 (95% CI: 12.3–14.0), with 23.4% of firms certified (World Bank Enterprise Survey, 2022a).
Financial Inclusion Effects on Sales: Checking or savings accounts (β=0.206, z=5.014, p<0.001) increase log sales by 0.206 units, or 22.9% (\exp(0.206) \approx 1.229) (Asongu, 2020; Jacolin et al., 2021). Overdraft facilities (β=0.265, z=12.347, p<0.001) raise sales by 30.4% (\exp(0.265) \approx 1.304) (Niankara & Islam, 2023). Lines of credit or loans (β=0.073, z=3.144, p=0.002) increase sales by 7.6% (\exp(0.073) \approx 1.076) (Calatayud & Rochina Barrachina, 2023).
Post-COVID Effects: The post-COVID period (β=−0.110, z=−2.639, p=0.008) reduces sales by 10.4% (\exp(-0.110) \approx 0.896) (Niankara & Traoret, 2023).
Digital Strategy Effects: Website-only firms (β=0.929, z=25.726, p<0.001) see a 153.2% sales increase (\exp(0.929) \approx 2.532). Email-only firms (β=0.415, z=9.182, p<0.001) gain 51.4% (\exp(0.415) \approx 1.514). Combined website and email (β=1.130, z=26.878, p<0.001) yields a 209.7% increase (\exp(1.130) \approx 3.097) (Cariolle & Piedade, 2023).
Firm Characteristics: External audits (β=0.422, p<0.001) increase sales by 52.5%. Medium-sized firms (β=0.531, p<0.001) and large firms (β=1.124, p<0.001) increase sales by 70.1% and 207.8%, respectively. Service firms have 42.7% lower sales than manufacturing (β=−0.556, p<0.001) (Azzaoui et al., 2023). Female-owned firms show an 8.1% sales reduction (β=−0.084, z=−3.724, p<0.001) (Lo Bue & Martínez-Zarzoso, 2024). Labor costs (β=0.924, z=258.068, p<0.001) increase sales by 0.924% per 1% cost increase.
Non-Linear Effects: Years of operation (s(nyearsOper): edf=3.899, p<0.001) show non-linear effects with diminishing returns. Regional effects (s(region): edf=4.967, p<0.001) highlight variation, with South Asia outperforming Latin America (Demirgüç-Kunt et al., 2019).
The significant theta (\theta=0.903, 95% CI: 0.897–0.908) and the cumulative probability plot in Figure 4 confirm endogeneity between certification and sales, validating the copula approach (Park & Gupta, 2012).
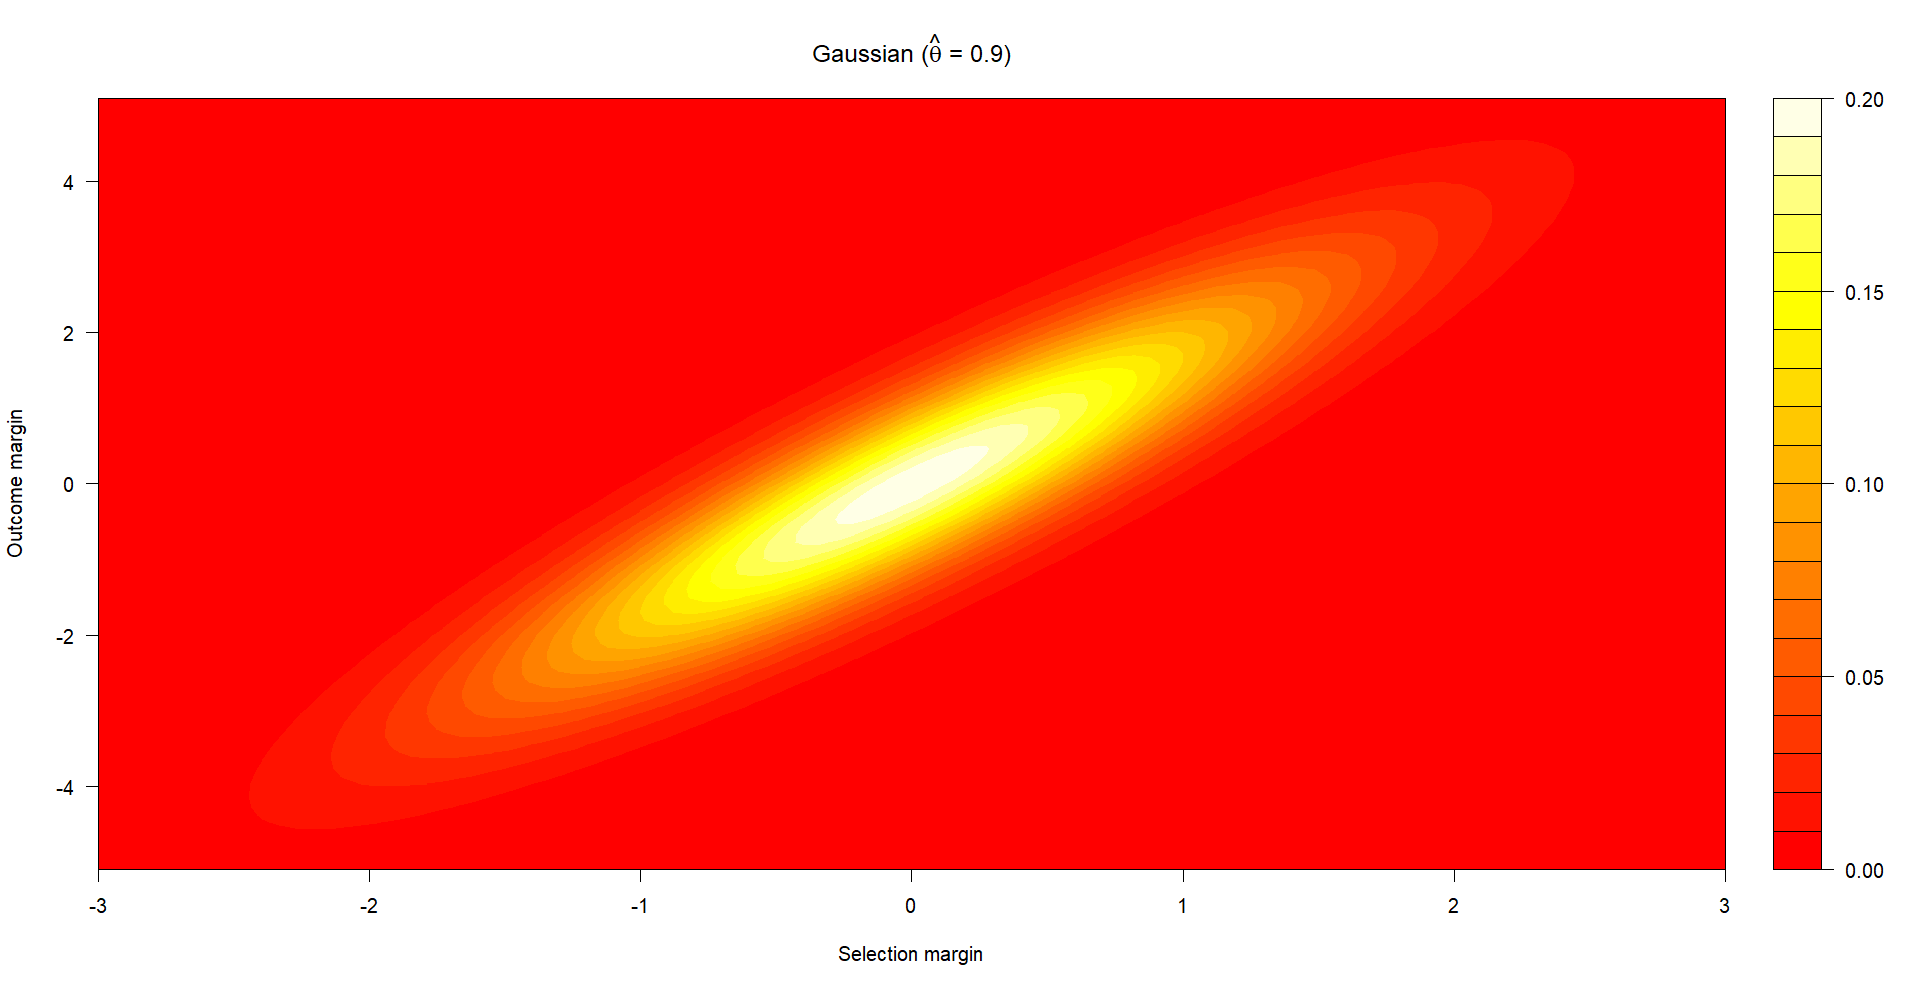
GJRM package in R. The plot visualizes the joint distribution of selection margin (Certification) and outcome margin (Sales) under a Gaussian copula with estimated dependence parameter \hat{\theta} = 0.9. The strong positive dependence confirms endogeneity.
Table 6: Econometric Results — Fully Parametric vs. Semi-Parametric Copula Models
| Variable | FP Est. (SE) | FP p-value | SP Est. (SE) | SP p-value |
|---|---|---|---|---|
| Selection Equation (iCert) | ||||
| (Intercept) | −1.237 (0.034) | <2e-16*** | −1.453 (0.136) | <2e-16*** |
| ChecAndORSavAccOwnshp1 | 0.138 (0.019) | 1.0e-13*** | 0.137 (0.019) | 1.7e-13*** |
| OverDraftFacility1 | 0.145 (0.011) | <2e-16*** | 0.143 (0.011) | <2e-16*** |
| LineCredORLoanFinInst1 | 0.035 (0.012) | 0.0025** | 0.035 (0.012) | 0.0028** |
| PeriodPostCovid | −0.093 (0.019) | 6.1e-07*** | −0.096 (0.019) | 2.9e-07*** |
| DigitStratg2WebsiteOnly | 0.593 (0.016) | <2e-16*** | 0.591 (0.016) | <2e-16*** |
| DigitStratg2EmailComly | 0.216 (0.020) | <2e-16*** | 0.217 (0.020) | <2e-16*** |
| DigitStratg2WebsEmailCom | 0.738 (0.018) | <2e-16*** | 0.738 (0.018) | <2e-16*** |
| extAudit1 | 0.289 (0.011) | <2e-16*** | 0.288 (0.011) | <2e-16*** |
| size2 | 0.308 (0.012) | <2e-16*** | 0.305 (0.012) | <2e-16*** |
| size3 | 0.715 (0.014) | <2e-16*** | 0.711 (0.014) | <2e-16*** |
| sector_MSServices | −0.349 (0.010) | <2e-16*** | −0.347 (0.010) | <2e-16*** |
| largFirm1 | 0.217 (0.013) | <2e-16*** | 0.218 (0.013) | <2e-16*** |
| AccsToFinObstOP | −0.032 (0.005) | 8.5e-13*** | −0.032 (0.005) | 2.6e-12*** |
| TranspObstOP | 0.025 (0.004) | 1.4e-08*** | 0.025 (0.004) | 1.6e-08*** |
| PolCorupt | 0.034 (0.004) | 3.0e-14*** | 0.034 (0.004) | 3.6e-14*** |
| s(nyearsOper) | — | — | edf=3.462 | <2e-16*** |
| s(region) | — | — | edf=4.991 | <2e-16*** |
| s(MangYrExpSect) | — | — | edf=5.696 | 0.0001*** |
| s(PercSenManTimGovReg) | — | — | edf=1.000 | 0.0003*** |
| Outcome Equation (logSales) | ||||
| (Intercept) | −0.209 (0.091) | 0.0221* | −0.232 (0.174) | 0.1836 |
| ChecAndORSavAccOwnshp1 | 0.211 (0.041) | 2.9e-07*** | 0.206 (0.041) | 5.3e-07*** |
| OverDraftFacility1 | 0.267 (0.022) | <2e-16*** | 0.265 (0.021) | <2e-16*** |
| LineCredORLoanFinInst1 | 0.076 (0.023) | 0.0011** | 0.073 (0.023) | 0.0017** |
| PeriodPostCovid | −0.099 (0.042) | 0.0182* | −0.110 (0.042) | 0.0083** |
| DigitStratg2WebsiteOnly | 0.933 (0.036) | <2e-16*** | 0.929 (0.036) | <2e-16*** |
| DigitStratg2EmailComly | 0.417 (0.045) | <2e-16*** | 0.415 (0.045) | <2e-16*** |
| DigitStratg2WebsEmailCom | 1.136 (0.042) | <2e-16*** | 1.130 (0.042) | <2e-16*** |
| extAudit1 | 0.423 (0.023) | <2e-16*** | 0.422 (0.023) | <2e-16*** |
| size2 | 0.540 (0.026) | <2e-16*** | 0.531 (0.026) | <2e-16*** |
| size3 | 1.135 (0.032) | <2e-16*** | 1.124 (0.032) | <2e-16*** |
| sector_MSServices | −0.561 (0.022) | <2e-16*** | −0.556 (0.022) | <2e-16*** |
| largFirm1 | 0.373 (0.024) | <2e-16*** | 0.374 (0.024) | <2e-16*** |
| femOwner1 | −0.084 (0.023) | 0.0002*** | −0.084 (0.022) | 0.0002*** |
| logLabCost | 0.924 (0.004) | <2e-16*** | 0.924 (0.004) | <2e-16*** |
| AccsToFinObstOP | −0.098 (0.009) | <2e-16*** | −0.098 (0.009) | <2e-16*** |
| TranspObstOP | 0.094 (0.009) | <2e-16*** | 0.094 (0.009) | <2e-16*** |
| PolCorupt | 0.027 (0.009) | 0.0029** | 0.027 (0.009) | 0.0029** |
| s(nyearsOper) | — | — | edf=3.899 | 3.2e-10*** |
| s(region) | — | — | edf=4.967 | <2e-16*** |
| s(MangYrExpSect) | — | — | edf=2.450 | 0.0033** |
| Model Parameters | ||||
| n | 96,952 | 96,952 | ||
| Sigma (95% CI) | 1.869 (1.844, 1.896) | 1.865 (1.839, 1.891) | ||
| Theta (95% CI) | 0.903 (0.897, 0.909) | 0.903 (0.897, 0.908) | ||
| Total edf | 68.000 | 79.464 |
6. Discussion
The semi-parametric bivariate mixed binary-continuous copula model (outSP) provides compelling evidence of the synergistic effects of formal financial inclusion and digital strategy on international quality certification and sales performance across 96,952 firms (World Bank Enterprise Survey, 2022a). The model’s superior fit (AIC=156,413.7 vs. 156,495.0 for outFP) and use of regression splines effectively capture non-linear relationships (Becker et al., 2022; Eilers & Marx, 1996). These findings align with signaling theory (Connelly et al., 2011) and the resource-based view (Helfat et al., 2023), reinforcing how financial and digital resources enhance firm competitiveness (Chauvet & Jacolin, 2017; He et al., 2025).
6.1 Financial Inclusion and Quality Certification
The selection equation results demonstrate that formal financial inclusion significantly boosts certification likelihood, with access to checking/savings accounts (β=0.137, p=1.7\times10^{-13}), overdraft facilities (β=0.143, p<2\times10^{-16}), and credit lines (β=0.035, p=0.0028) as key drivers. These findings align with RBV, where financial resources enable investments in strategic assets like certifications (He et al., 2025; Helfat et al., 2023). The high prevalence of account ownership (87.3%) compared to limited credit access (22.6%) mirrors global patterns reported by Demirguc-Kunt et al. (2018) and Chauvet & Jacolin (2017), indicating that basic financial access is foundational for SMEs, yet credit constraints persist (Dela Cruz et al., 2023; Zaki, 2024). The negative post-COVID effect (β=−0.096, p=2.9\times10^{-7}) reflects economic disruptions limiting liquidity for certification investments, consistent with Niankara & Traoret (2023).
6.2 Digital Strategy as a Performance Driver
Digital strategy significantly enhances both certification and sales performance, with firms using both websites and email (β=0.738 for certification; β=1.130 for sales; both p<2\times10^{-16}) showing the strongest effects. These results align with signaling theory, where digital tools signal modernity and reliability (Bose et al., 2017; Connelly et al., 2011). The 1.13 log-unit sales increase underscores digitalization’s role in market expansion for manufacturing firms, as supported by Alshareef & Tunio (2022). Pang et al. (2024) further confirm that digital financial inclusion and ICT drive firm performance in China, though Vu et al. (2025) caution that increased borrowings may reduce return on assets, suggesting sector-specific trade-offs. The moderate digital adoption rate (34.1% lack digital tools) indicates untapped potential, especially in services (Mahato & Kanth, 2025).
6.3 Sectoral and Firm Size Differences
The negative coefficients for services firms (β=−0.347 for certification; β=−0.556 for sales; both p<2\times10^{-16}) confirm manufacturing firms’ superior outcomes (Niankara, 2024). Manufacturing firms benefit from standardized processes conducive to certifications like ISO 9001 (Alshahrani & Husain, 2023; Azzaoui et al., 2023). Larger firms (β=0.711 for certification; β=1.124 for sales) and large firm affiliation outperform smaller firms, reflecting economies of scale (Lepistö et al., 2022; Munodawafa et al., 2024). The negative effect for female-owned firms (β=−0.084, p=0.0002) aligns with Lo Bue & Martínez-Zarzoso (2024) and Peter et al. (2025), highlighting persistent financial and digital access constraints for women entrepreneurs. Williams et al. (2025) and He et al. (2025) suggest targeted financial inclusion interventions can mitigate these gaps.
6.4 Endogeneity and Model Robustness
The significant theta parameter (θ=0.903, 95% CI: 0.897–0.908) confirms strong positive dependence between certification and sales, validating the copula approach (Bhattacharyya & Khan, 2023; Park & Gupta, 2012). The semi-parametric model’s splines for nyearsOper, MangYrExpSect, and region capture non-linear effects such as diminishing returns to firm age and regional variations (Pang et al., 2024; Wood, 2017). Boef et al. (2014) cautions that large sample sizes (n=96,952) may inflate statistical significance, recommending robustness checks with alternative copula distributions (Klein et al., 2019).
7. Policy Implications
The econometric results underscore the transformative role of formal financial inclusion and digital strategies in enhancing international quality certification and sales performance across 148 economies. Key recommendations follow.
Enhancing Financial Inclusion: The significant positive effects of financial inclusion on certification (6–7% probability increase for overdraft facilities) and sales (up to 30.4%) highlight the urgent need to expand formal financial services access, particularly for SMEs (Chauvet & Jacolin, 2017). Governments should prioritize microfinance programs, loan guarantees, and subsidized credit facilities (Asongu, 2020; Calatayud & Rochina Barrachina, 2023). Policies promoting overdraft facilities could provide critical liquidity for certification and operational investments (He et al., 2025; Niankara & Islam, 2023).
Promoting Digital Adoption: The substantial impact of combined digital strategies (209.7% sales increase) underscores the urgency of addressing the digital divide, with 34.1% of firms lacking digital tools (Pang et al., 2024). Governments should implement digital adoption subsidies and training programs, with sector-specific strategies (Al Zobi et al., 2025; Bansal et al., 2025; Cariolle & Piedade, 2023).
Addressing Post-COVID Recovery: Governments should offer temporary financial relief such as tax breaks or grants, and certification cost subsidies, to mitigate pandemic-driven disruptions and restore certification uptake and sales growth (Bhattacharyya & Khan, 2023; Niankara & Traoret, 2023).
Promoting Gender Inclusivity: The 8.1% lower sales for female-owned firms indicate persistent gender-based barriers (Peter et al., 2025). Policymakers should implement targeted women-focused microcredit schemes and digital financial literacy programs (Dela Cruz et al., 2023; Mahato & Kanth, 2025; Williams et al., 2025).
Bridging Regional Divides: Significant regional variations indicate the need for region-specific policies, including investments in digital infrastructure in rural and underperforming areas (Demirgüç-Kunt et al., 2019; He et al., 2025). Bank competition enhances financial inclusion’s impact on firm performance, recommending policies to foster competitive banking environments (Chauvet & Jacolin, 2017).
Mitigating External Constraints: Policies should target economy formalization, streamlined tax structures, and governance reforms (Bose et al., 2017; Jacolin et al., 2021). Fintech governance can enhance transparency while mitigating corruption risks (Al Zobi et al., 2025).
8. Conclusion and Future Research
This study underscores the transformative role of formal financial inclusion and digital strategies in driving international quality certification and sales performance across 96,952 firms in 148 economies, with manufacturing and larger firms exhibiting superior outcomes. The semi-parametric bivariate mixed binary-continuous copula model robustly captures endogeneity and non-linear effects, providing a comprehensive framework for understanding firm dynamics in emerging economies (Bhattacharyya & Khan, 2023; Helfat et al., 2023; Park & Gupta, 2012). By integrating signaling theory and the resource-based view, the findings highlight the strategic value of certifications and digital tools in reducing information asymmetry and enhancing competitive advantage (Bose et al., 2017; Connelly et al., 2011). Policymakers should prioritize inclusive financial systems, digital infrastructure, and gender-focused interventions to foster sustainable growth, aligning with global sustainable development goals (Bansal et al., 2025; Dela Cruz et al., 2023).
Several limitations persist. The bivariate normal copula assumes Gaussian dependence, which may overlook asymmetric tail dependencies; alternative copulas (e.g., Clayton, Gumbel) could better capture extreme effects (Becker et al., 2022). Self-reported WBES data may introduce response biases, though the large sample size mitigates this concern (World Bank Enterprise Survey, 2022b). Future research could explore interaction effects between financial inclusion and digital strategies (Al Zobi et al., 2025), the mediating role of digital financial literacy (Peter et al., 2025), and longitudinal post-COVID recovery dynamics (He et al., 2025; Niankara & Traoret, 2023). Equity and inclusivity for female-led firms warrant deeper investigation (Mahato & Kanth, 2025; Peter et al., 2025), and the role of corporate social responsibility in enhancing financial inclusion’s impact on firm performance merits further study (Bhattacharyya & Khan, 2023; Bose et al., 2017).
Declarations
- Funding: Not applicable.
- Conflict of interest: The author declares no competing interests.
- Ethics approval and consent to participate: Not applicable.
- Data availability: The data used in this research is available upon reasonable request.
- Code availability: R code is available upon reasonable request.
- CRediT authorship contribution statement: Conceptualization, methodology, analysis, writing.
References
Al Zobi, M. K., Qawqzeh, H. K., & Abu-Allan, A. J. (2025). FINTECH GOVERNANCE AND FIRMS’ PERFORMANCE: DOES FINANCIAL LITERACY MATTER? Journal of Governance and Regulation, 14(3), 39–48. https://doi.org/10.22495/jgrv14i3art4
Alshahrani, M. A., & Husain, K. S. (2023). The effectiveness of the implementation of ISO 9001 on SMEs performance: The case of an emerging economy. International Journal of Quality & Reliability Management.
Asongu, S. A. (2020). Financial access and productivity dynamics in sub-saharan africa. International Journal of Public Administration, 43(12), 1029–1041.
Astrini, N. (2018). ISO 9001 and performance: A method review. Total Quality Management & Business Excellence, 1–28.
Azzaoui, K., Yousfi, S., & Bouamrani, M. L. (2023). The benefits of combining digitalization with quality tools: Application in the field of wiring systems manufacturing for the automotive industry. Smart Applications and Data Analysis: 4th International Conference, SADASC 2022, Marrakesh, Morocco, September 22–24, 2022, Proceedings, 308–322.
Ballina, F. J., Valdés, L., & Del Valle, E. (2020). The signalling theory: The key role of quality standards in the hotels performance. Journal of Quality Assurance in Hospitality & Tourism, 21(2), 190–208.
Bansal, S., Kumar, S., Ali, S., Singh, S., Nangia, P., & Bamel, U. (2025). Harnessing digital finance for sustainability: An integrative review and research agenda. Research in International Business and Finance, 74. https://doi.org/10.1016/j.ribaf.2024.102682
Barbosa, A. D. S., Bueno da Silva, L., Morioka, S. N., Silva, J. M. N. da, & Souza, V. F. de. (2023). Integrated management systems and organizational performance: A multidimensional perspective. Total Quality Management & Business Excellence, 1–39.
Becker, J. M., Proksch, D., & Ringle, C. M. (2022). Revisiting gaussian copulas to handle endogenous regressors. Journal of the Academy of Marketing Science, 50(1), 46–66.
Bhandari, K. R., Zámborský, P., Ranta, M., & Salo, J. (2023). Digitalization, internationalization, and firm performance: A resource-orchestration perspective on new OLI advantages. International Business Review, 102135.
Bhattacharyya, A., & Khan, M. (2023). Financial inclusion, corporate social responsibility and firm performance – analysis of interactive relationship. Meditari Accountancy Research, 31(2), 417–440. https://doi.org/10.1108/MEDAR-12-2020-1121
Boef, A. G., Dekkers, O. M., Vandenbroucke, J. P., & Cessie, S. le. (2014). Sample size importantly limits the usefulness of instrumental variable methods, depending on instrument strength and level of confounding. Journal of Clinical Epidemiology, 67(11), 1258–1264.
Bose, S., Saha, A., Khan, H. Z., & Islam, S. M. N. (2017). Non-financial disclosure and market-based firm performance: The initiation of financial inclusion. Journal of Contemporary Accounting and Economics, 13(3), 263–281. https://doi.org/10.1016/j.jcae.2017.09.006
Calatayud, C., & Rochina Barrachina, M. E. (2023). How do firms in sub-saharan africa benefit from global value chains? South African Journal of Economics, 91(2), 214–241. https://doi.org/10.1111/saje.12340
Cariolle, J., & Piedade, C. da. (2023). Digital connectedness and exports upgrading: Is sub-saharan africa catching up? The World Economy, 46(11), 3325–3344.
Chauvet, L., & Jacolin, L. (2017). Financial inclusion, bank concentration, and firm performance. World Development, 97, 1–13. https://doi.org/10.1016/j.worlddev.2017.03.018
Connelly, B. L., Certo, S. T., Ireland, R. D., & Reutzel, C. R. (2011). Signalling theory: A review and assessment. Journal of Management, 37(1), 39–67.
Dela Cruz, N. A. O., Villanueva, A. C. B., Tolin, L. A., Disse, S., Lensink, R., & White, H. (2023). PROTOCOL: Effects of interventions to improve access to financial services for micro-, small- and medium-sized enterprises in low- and middle-income countries: An evidence and gap map. Campbell Systematic Reviews, 19(3). https://doi.org/10.1002/cl2.1341
Demirguc-Kunt, A., Klapper, L., Singer, D., Ansar, S., & Hess, J. (2018). The global findex database 2017: Measuring financial inclusion and the fintech revolution. World Bank Publications.
Demirgüç-Kunt, A., Hu, B., & Klapper, L. (2019). Financial inclusion in the europe and central asia region: Recent trends and a research agenda. World Bank Policy Research Working Paper, (8830).
Eckert, C., & Franses, P. H. (2022). Gaussian copula regression in the presence of thresholds (2022-02). Erasmus University Rotterdam, Erasmus School of Economics (ESE), Econometric Institute.
Eilers, P. H., & Marx, B. D. (1996). Flexible smoothing with b-splines and penalties. Statistical Science, 11(2), 89–121.
Fersi, M., Boujelbéne, M., & Arous, F. (2023). Microfinance’s digital transformation for sustainable inclusion. European Journal of Management and Business Economics, 32(5), 525–559. https://doi.org/10.1108/EJMBE-10-2022-0332
Hadidi, L., Assaf, S., Aluwfi, K., & Akrawi, H. (2017). The effect of ISO 9001 implementation on the customer satisfaction of the engineering design services. International Journal of Building Pathology and Adaptation, 35(2), 176–190.
He, M., Bai, Y., Liu, F., & Stamatogiannis, M. P. (2025). Geographical and educational disparities: How credit access drives performance convergence in chinese MSMEs. Finance Research Letters, 85. https://doi.org/10.1016/j.frl.2025.108057
Helfat, C. E., Kaul, A., Ketchen Jr, D. J., Barney, J. B., Chatain, O., & Singh, H. (2023). Renewing the resource-based view: New contexts, new concepts, and new methods. Strategic Management Journal, 44(6), 1357–1390.
Heredia, J., Garcés-Galdeano, L., García-Paucar, L., & García-García, D. (2022). How do digital capabilities affect firm performance? The mediating role of technological capabilities. European Journal of Management and Business Economics, 31(3), 301–320.
Heubeck, T. (2023). Managerial capabilities as facilitators of digital transformation? Dynamic managerial capabilities as antecedents to digital business model transformation and firm performance. Digital Business, 3(1), 100053.
Jacolin, L., Keneck Massil, J., & Noah, A. (2021). Informal sector and mobile financial services in emerging and developing countries: Does financial innovation matter? The World Economy, 44(9), 2703–2737.
Khin, S., & Ho, T. C. F. (2018). Digital technology, digital capability and organizational performance: A mediating role of digital innovation. International Journal of Innovation, Science and Research, 9(2), 306–327.
Klein, N., Kneib, T., Marra, G., Radice, R., Rokicki, S., & McGovern, M. E. (2019). Mixed binary-continuous copula regression models with application to adverse birth outcomes. Statistics in Medicine, 38(3), 413–436.
Koutroumpis, P., & Sarri, D. (2024). The economic impact of broadband access for small firms. The World Economy, 47(4), 1642–1681.
Lashitew, A. A. (2014). The effect of political connections on credit access: Does the level of financial development matter? Kyklos, 67(2), 227–254. https://doi.org/10.1111/kykl.12051
Lepistö, K., Saunila, M., & Ukko, J. (2022). Facilitating SMEs’ profitability through total quality management: The roles of risk management, digitalization, stakeholder management and system deployment. The TQM Journal, 34(6), 1572–1599.
Liu, Y., Dong, J., Mei, L., & Shen, R. (2023). Digital innovation and performance of manufacturing firms: An affordance perspective. Technovation, 119, 102458.
Lo Bue, M. C., & Martínez-Zarzoso, I. (2024). Female managers and firm performance: Evidence from the non-agricultural sectors in caribbean countries. Economic Modelling, 133. https://doi.org/10.1016/j.econmod.2024.106648
Ma, X., & Gu, X. (2024). New marketing strategy model of e-commerce enterprises in the era of digital economy. Heliyon, 10(8).
Mahato, J., & Kanth, D. (2025). Investigating the influence of digital financial inclusion on the performance of family firms in india: Does financial well-being mediate? Global Knowledge, Memory and Communication. https://doi.org/10.1108/GKMC-08-2024-0515
Marra, G., & Radice, R. (2018). Generalized joint regression modelling-GJRM. CRAN packages Version 0.2-5.1.
Martinez-Caro, E., Cegarra-Navarro, J. G., & Alfonso-Ruiz, F. J. (2020). Digital technologies and firm performance: The role of digital organisational culture. Technological Forecasting and Social Change, 154, 119962.
Mayer, J. (2021). Development strategies for middle-income countries in a digital world—insights from modern trade economics. The World Economy, 44(9), 2515–2546.
Minarni, E. (2025). Impact of digital payment systems on financial inclusion and small business growth in developing economies. International Journal of Innovation and Thinking, 2(1), 1–12.
Moratis, L. (2018). Signalling responsibility? Applying signalling theory to the ISO 26000 standard for social responsibility. Sustainability, 10(11), 4172.
Mpofu, F. Y., & Mpofu, Q. (2024). The role of fintech and the fourth industrial revolution technologies in the advancement of digital financial inclusion in developing economies. In Responsible Business and Sustainable Development: the Use of Data and Metrics in the Global South (pp. 30–56). https://doi.org/10.4324/9781032712246-4
Munodawafa, T., Naude, M., & Govender, K. K. (2024). Assuring the sustainability and growth of small and medium-sized manufacturing enterprises in botswana: An exploratory study. International Journal of Economics and Financial Issues, 14(4), 253–266. https://doi.org/10.32479/ijefi.16632
Niankara, I. (2023). Socio-economic and geospatial determinants of households’ food and non-food consumption dynamics within the west african economic and monetary union. Scientific African, 20, e01724.
Niankara, I. (2024). Evaluating the influence of digital strategy on the interplay between quality certification and sales performance using data science and machine learning algorithms. Journal of Open Innovation: Technology, Market, and Complexity, 10(3), 100354. https://doi.org/10.1016/j.joitmc.2024.100354
Niankara, I., & Islam, A. R. M. (2023). The impact of B2P electronic payroll and G2P digital welfare on formal financial inclusion in the global open economy. Journal of Open Innovation: Technology, Market, and Complexity, 9(2), 100034.
Niankara, I., & Traoret, R. I. (2023). The digital payment-financial inclusion nexus and payment system innovation within the global open economy during the COVID-19 pandemic. Journal of Open Innovation: Technology, Market, and Complexity, 9(4), 100173.
Nurcahyo, R., Habiburrahman, M., et al. (2021). Relationship between ISO 9001: 2015 and operational and business performance of manufacturing industries in a developing country (indonesia). Heliyon, 7(1).
Pang, F., Ozturk, I. T., & Sohail, S. (2024). Environmental technology and firm performance: The role of digital financial inclusion, information and communication technology, and education. Natural Resources Forum. https://doi.org/10.1111/1477-8947.12545
Park, S., & Gupta, S. (2012). Handling endogenous regressors by joint estimation using copulas. Marketing Science, 31(4), 567–586.
Peter, S., Elangovan, G., & Gupta, A. (2025). Digital engagement in financial inclusion for bridging the gendered entrepreneurial financial gap: Evidence from india. Cogent Business and Management, 12(1). https://doi.org/10.1080/23311975.2025.2518492
Shah, N., Zehri, A. W., Saraih, U. N., Abdelwahed, N. A. A., & Soomro, B. A. (2024). The role of digital technology and digital innovation towards firm performance in a digital economy. Kybernetes, 53(2), 620–644.
Sharma, V. M., & Klein, A. (2025). A signaling theory-based analysis of website features, investment perception and trust propensity in initial trust formation on unfamiliar small online retailers. Journal of Marketing Theory and Practice, 33(2), 232–253.
Suh, J., & Roh, J. (2023). The effects of digital trade policies on digital trade. The World Economy, 46(8), 2383–2407.
Terlaak, A., & King, A. A. (2006). The effect of certification with the ISO 9000 quality management standard: A signaling approach. Journal of Economic Behavior & Organization, 60(4), 579–602.
Tsao, M. (2024). Regression model selection via log-likelihood ratio and constrained minimum criterion. Canadian Journal of Statistics, 52(1), 195–211.
Ullah, B. (2020). Signaling value of quality certification: Financing under asymmetric information. Journal of Multinational Financial Management, 55, 100629.
Vu, M., Tran, T., Thai, D., Phuong, L., & Le, T. T. (2025). The mediating role of corporate borrowings in the nexus between financial inclusion and performance of ICT firms: New insights from vietnam. Applied Economics, 57(30), 4379–4393. https://doi.org/10.1080/00036846.2024.2360144
Wayoro, D., Nonguierma, W., & Parkouda, M. (2025). Upfront efforts for upcoming benefits? ISO 9001: 2015 certification and firms’ performance in 33 countries. International Economics, 100620.
Williams, P. A., Akon-Yamga, G., Onumah, J. A., Akuffobea-Essilfie, M., Quaye, W., & Agyemang, A. (2025). Understanding the impact of innovation and other business support interventions on SMEs’ development–lessons from sub-saharan africa from an evidence-based review. African Journal of Science, Technology, Innovation and Development, 17(1), 80–94. https://doi.org/10.1080/20421338.2024.2421290
Wood, S. N. (2017). Generalized additive models: An introduction with r. CRC Press.
World Bank Enterprise Survey. (2022a). Data. https://www.enterprisesurveys.org/en/data.
World Bank Enterprise Survey. (2022b). Methodology. https://www.enterprisesurveys.org/en/methodology.
Wu, J., Luo, Z., & Wood, J. (2023). How do digital trade rules affect global value chain trade in services?—analysis of preferential trade agreements. The World Economy, 46(10), 3026–3047.
Wysokińska, Z. (2021). A review of the impact of the digital transformation on the global and european economy. Comparative Economic Research. Central and Eastern Europe, 24(3), 75–92.
Zaki, C. (2024). Why don’t firms grow? Evidence from egypt. International Journal of Economic Policy in Emerging Economies, 20(3-4), 347–369. https://doi.org/10.1504/IJEPEE.2024.142461