Green Technology Innovation and Firm-Level Technical Efficiency: A Two-Stage Analysis in the Philippines
DEA-Tobit Analysis of 748 Philippine Firms from the 2024 World Bank Enterprise Survey
Other Digital Innovation Economics
A peer-reviewed IEEE conference paper applying two-stage DEA-Tobit analysis to 748 Philippine firms (WBES 2024 Green Economy module). Finds that green technology innovation (GreenInov2 index) improves firm-level technical efficiency by 7.3–8.7%, with amplified gains for large firms and urban manufacturers. Published at IEEE GCET 2025, Lyon, France.
1 Abstract
This study examines how green technology innovation (GI) influences firm-level technical efficiency in the Philippines, applying the Resource-Based View (RBV) and institutional theory Using data from 748 firms in the 2024 World Bank Enterprise Survey Green Economy module, a two-stage method is employed First, Data Envelopment Analysis measures technical efficiency across firms of different sizes, sectors, and regions Second, a control function Tobit model assesses the impact of GI (via the GreenInov2 index), adjusting for internal resources (e g , financial access, energy and internet costs, labor, and managerial experience) and external pressures (e g , environmental inspections, climate strategies). Results show GI improves efficiency by 7.3-8.7%, with greater gains for large firms and urban manufacturers, especially in Calabarzon. Robustness is confirmed using alternative metrics and instrumental variable models. The findings position GI as a VRIN resource under RBV and highlight the role of regulation under institutional theory.
Keywords: Green technology innovation, technical efficiency, Resource-Based View, institutional theory, Data Envelopment Analysis, Tobit model
2 Introduction
The global economic landscape in the 21st century has been profoundly reshaped by the imperatives of sustainable industrialization and technological transformation, particularly within emerging markets (Larbi-Siaw et al. 2022; Le et al. 2024). As global value chains pivot toward green production systems, the interplay between technological innovation and environmental sustainability has emerged as a critical focus for policymakers, corporate strategists, and scholars (Mohsin et al. 2022; Behera, Haldar, and Sethi 2023). This shift reflects a broader recognition that sustainable practices are not merely regulatory obligations but strategic imperatives that enhance firm competitiveness and resilience in an increasingly volatile global economy (Ghadimi, Wang, and Lim 2019; Baah and Jin 2019). However, integrating green technologies into firms’ operational and strategic frameworks poses significant challenges, particularly in resource-constrained emerging economies where regulatory asymmetries and institutional frictions complicate the transition to sustainable business models (Dhillon et al. 2023; Ushie et al. 2023).
Asia, home to some of the world’s most dynamic economies, stands at the forefront of this transformation (Wen et al. 2022). Countries across the region have introduced stringent environmental policies while fostering private-sector investment in sustainable production capabilities (Sharif et al. 2023; Qing et al. 2024). Yet, the extent to which firms in emerging Asian economies leverage green innovations to enhance operational efficiency and productivity remains underexplored. Existing literature often focuses on environmental footprint effects (Khan et al. 2021), or developed economies context, leaving a critical gap in understanding the dynamics of green technology adoption in emerging markets (S. Liu, Thurasamy, and Hati 2024; Shahzad et al. 2022). This gap is particularly pronounced in the context of the Philippines, a key player in Southeast Asia’s industrial and service sectors, where firms face mounting pressure to align with global sustainability benchmarks while maintaining cost competitiveness (Department of Energy, Philippines 2023; De Robles, De Leon, and Manapat 2021).
The Philippines presents a compelling case for examining green technological transformations. With energy prices among the highest in Asia and a national commitment to reducing greenhouse gas emissions by 75% by 2030 under its Nationally Determined Contribution (NDC) (Giraudet 2020), the country is navigating a delicate balance between economic growth and environmental stewardship. The 2019 Energy Efficiency and Conservation (EEC) Act and the National Energy Efficiency and Conservation Plan (NEECP) Roadmap (2023–2050) underscore the strategic importance of energy-efficient technologies in achieving sustainable development (Department of Energy, Philippines 2023). Within this context, firms in the Philippines’ diverse manufacturing and service sectors are increasingly adopting green innovations—such as Energy Star-rated appliances and energy-efficient lighting—to enhance efficiency and align with global standards (Behera, Haldar, and Sethi 2023; C.-C. Lee and Wen 2025). However, empirical evidence on the efficiency gains and financial implications of these innovations remains scarce, necessitating rigorous analytical approaches to elucidate their impact on firm performance (Duque-Grisales and Aguilera-Caracuel 2021).
Therefore, this study aims to: (1) empirically quantify GI’s impact on technical efficiency using a two-stage DEA-econometric model with WBES data, (2) examine the role of firm resources and external pressures, and (3) provide policy insights for sustainable innovation (Yang et al. 2022). By offering actionable insights into the trade-offs and synergies of green technology adoption, this research contributes to both academic literature and managerial practice, aligning with the United Nations Sustainable Development Goals (SDGs) 7, 8, 9, and 12 (Department of Energy, Philippines 2023; Quarshie, Salmi, and Leuschner 2016). The findings inform corporate strategies and policy frameworks aimed at fostering sustainable industrialization in emerging economies.
Hence, the remainder of the paper is organized as follows: Section 3 reviews the literature, identifying key themes and hypotheses. Section 4 delineates the methodology, including the theoretical framework, econometric model, and data sources. Section 5 presents the empirical results and their discussion. Section 6 explores the theoretical, practical, and policy implications, while Section 7 concludes with limitations and directions for future research.
3 Literature Review
The present review synthesizes insights from articles, industry reports, and authoritative sources like the International Energy Agency (IEA) and World Intellectual Property Organization (WIPO), ensuring a robust foundation for analyzing green technology innovation (GI) and firm-level technical efficiency (World Intellectual Property Organization 2022). The literature is selected to address the interplay of firm strategy, theoretical frameworks, and empirical outcomes, with a focus on methodological rigor to support the proposed two-stage empirical approach using WBES data. As presented below, five key themes emerge from the literature: (1) Green Technology and Firm Strategy, (2) Theoretical Foundations (Resource-Based View and Institutional Theory), (3) Technical Efficiency, (4) Revenue Performance, and (5) Heterogeneity. These themes frame GI as a transformative force for firm performance, aligning with SDG 9 (Industry, Innovation, and Infrastructure).
3.1 Thematic Evaluation
Green Technology and Firm Strategy
Green technology adoption, encompassing energy-efficient processes, renewable energy integration, and low-emission innovations, has evolved from a regulatory necessity to a strategic imperative, driven by climate change, stakeholder demands (e.g., ESG investors), and resource scarcity (Purwandani and Michaud 2021; D. Wang, Si, and Fahad 2023; Indrawati et al. 2025). The seminal “Porter Hypothesis” (Ambec and Barla 2006) posits that environmental innovations enhance productivity through resource efficiency and product differentiation, challenging the traditional trade-off between profitability and sustainability. Empirical evidence supports this, with firms achieving 15–30% energy savings in manufacturing (International Energy Agency 2020) and accessing premium markets via eco-labeling (Ambec and Barla 2006). For instance, Ambec and Barla (2006) demonstrate that GI reshapes production functions, optimizing input-output dynamics and strengthening market positioning. This necessitates firm-level analyses to quantify GI’s impact on technical efficiency and financial performance, particularly in high-impact sectors like manufacturing (Ghadimi, Wang, and Lim 2019).
Theoretical Foundations: Resource-Based View (RBV) and Institutional Theory
The Resource-Based View (RBV) frames GI as a strategic resource meeting the VRIN criteria (valuable, rare, inimitable, non-substitutable), generating sustained competitive advantages (Barney 1991). Green technologies reduce long-term costs (e.g., energy savings; Ambec and Barla (2006)), signal quality to eco-conscious consumers (Aragón-Correa and Sharma 2003), and foster innovation spillovers (Miao and Popp 2014). Aragón-Correa and Sharma (2003) extends RBV, emphasizing environmental capabilities in resource-constrained settings. Institutional theory complements RBV by highlighting external pressures, such as regulatory frameworks and stakeholder expectations (Miao and Popp 2014). For example, stringent regulations like the EU’s Emissions Trading System drive proactive GI adoption (Calel and Dechezleprêtre 2016), while less regulated regions lag, creating spatial heterogeneity (Popp 2011). Industry-specific pressures also vary, with manufacturing facing greater scrutiny and thus higher efficiency gains than service sectors (Chen et al. 2020; Moshood et al. 2022; T. X. Lin, Wu, and Yang 2023; Huang and Huang 2024).
Green Technology and Technical Efficiency
Technical efficiency, the ability to maximize output from given inputs (Farrell 1957), is a critical metric for assessing GI’s impact, typically measured via Data Envelopment Analysis (DEA) (Banker, Charnes, and Cooper 1984; Cooper 2013; Pei et al. 2019) or Stochastic Frontier Analysis (SFA) (Kuosmanen, Johnson, and Saastamoinen 2015; Fahmy-Abdullah, Sieng, and Isa 2021). The extent research evaluating green technology innovation and efficiency is characterized by two literature trends, distinctive in their conceptual focus, measurement, and analytical objectives (Chen et al. 2020; Y. Zhang, Chen, and He 2022; T. X. Lin, Wu, and Yang 2023; L. Liu, Zhang, and Xu 2024). The first literature strand evaluates green innovation as the outcome, developing the concept of “Green Innovation Efficiency (GIE)” to assess an innovation system’s performance rather than firm’s operational performance. Its conceptual focus refers to how effectively GTI processes convert inputs (e.g., R&D investments, human capital, and policy incentives) into desired outputs (e.g., patents, energy-efficient products, and carbon reduction technologies) (K.-H. Lee and Min 2015; B. Lin and Xie 2024; J. Lin et al. 2024). Consistent with our current focus, the second literature trend addresses green innovation as the cause of firm’s technical efficiency. Its conceptual focus examines how the adoption and implementation of GTI influence a firm’s overall operational efficiency in converting inputs (i.e., labor, energy, and materials) into outputs (e.g. goods and services). It evaluates whether green innovation improves a firm’s productivity, cost-effectiveness, and competitiveness (Adanma and Ogunbiyi 2024; Huang and Huang 2024).
Reports from this latter perspective show that GTI enhance efficiency through input optimization (e.g., reducing energy waste) and process innovation (e.g., IoT-enabled monitoring) (Bai and Lin 2024; Z. Wang et al. 2024). For instance, Amornkitvikai, O’Brien, and Bhula-or (2024) found that Thai manufacturing firms with green investments achieved higher efficiency scores, while R. Li and Ramanathan (2018) report 10–15% gains in Chinese manufacturing due to reduced material and energy inputs. However, short-term efficiency dips occur, particularly for SMEs, due to high adoption costs (Shahin, Alimohammadlou, and Abbasi 2024), with Ambec and Barla (2006) noting temporary productivity losses during integration. Sectoral variations are evident, with high-impact sectors (e.g., manufacturing) showing stronger gains than services, where benefits are indirect (e.g., brand equity; Aragón-Correa and Sharma (2003)). Methodological advances, such as Simar and Wilson (2007)’s two-stage DEA and Kuosmanen, Johnson, and Saastamoinen (2015)’s stochastic nonparametric framework, enhance estimation by addressing biases and incorporating environmental variables, supporting the current two-stage approach (Chen et al. 2020; Y. Zhang, Chen, and He 2022). Recently however, machine learning techniques are increasingly being used as robust alternatives (Guillen, Aparicio, and España 2023; Veiga 2025).
Revenue Performance
GI impacts revenue through direct and indirect pathways. Cost leadership arises from energy-efficient technologies, with D. Zhang, Rong, and Ji (2019) reporting significant cost reductions in Chinese firms. Differentiation via eco-labels commands 5–10% price premiums in B2C markets (Asadi et al. 2020). Risk mitigation through regulatory compliance avoids fines, particularly in carbon-taxed regions (Ashraf et al. 2020). Meta-analyses by Endrikat, Guenther, and Hoppe (2014) confirm a positive environmental-financial performance correlation, with stronger effects in innovation-intensive and consumer-facing industries. Smaller firms face higher adoption barriers, limiting effect sizes (Duque-Grisales and Aguilera-Caracuel 2021). Indirect pathways, such as enhanced stakeholder trust and ESG capital access, further amplify revenue (Ma et al. 2023; Ali et al. 2024), reinforcing GI’s strategic value.
Heterogeneity
GI outcomes vary across spatial, industry, and firm-level dimensions (Nie et al. 2022). Spatial heterogeneity stems from regulatory pressures (e.g., EU’s carbon pricing; Calel and Dechezleprêtre (2016)), resource endowments (e.g., solar-rich regions; De Groote and Verboven (2019)), and knowledge spillovers in innovation clusters (Bai and Lin 2024; Zhao, Tang, and Huang 2025). Industry heterogeneity shows manufacturing, energy, and transport gaining direct efficiency benefits due to high resource intensity (R. Li and Ramanathan 2018), while service sectors gain reputational benefits (Aragón-Correa and Sharma 2003). Emerging industries leverage digital transformation for amplified GI impacts (El-Kassar and Singh 2019). Firm-level heterogeneity highlights larger firms’ ability to absorb adoption costs via economies of scale (Duque-Grisales and Aguilera-Caracuel 2021), R&D-intensive firms’ faster innovation due to financial slack (Leyva-de la Hiz, Ferron-Vilchez, and Aragon-Correa 2019), and higher returns from green-skilled workforces (G. Li, Lim, and Wang 2020).
3.2 Methodological Gaps
Prior research faces limitations that the proposed empirical approach addresses. Endogeneity arises as efficient firms are more likely to adopt GI (R. Li and Ramanathan 2018). Data scarcity complicates firm-level analysis due to proprietary or inconsistent metrics (Duque-Grisales and Aguilera-Caracuel 2021). Static analysis in cross-sectional studies misses dynamic adoption effects (Wooldridge 2010). The two-stage DEA-econometric approach using WBES data addresses these by: (1) employing a control function Tobit model to mitigate endogeneity (Papke and Wooldridge 1996), (2) leveraging comprehensive firm-level data from the 2024 WBES Green Economy module (World Bank Group 2024a), and (3) incorporating fixed effects to capture heterogeneity (Wooldridge 2010).
3.3 Emerging Hypotheses
The literature informs the following hypotheses, tailored to the manuscript’s focus:
- H1: GI positively affects technical efficiency by optimizing inputs and processes (R. Li and Ramanathan 2018; Amornkitvikai, O’Brien, and Bhula-or 2024).
- H2: Internal resources (financial, internet, labor, electricity, water, managerial experience) significantly influence efficiency (Barney 1991; G. Li, Lim, and Wang 2020).
- H3: GI adoption is driven by climate strategy, regulatory inspections, and past revenue (Miao and Popp 2014; Calel and Dechezleprêtre 2016).
- H4: GI interacts with firm size to enhance efficiency, leveraging economies of scale (Aragón-Correa and Sharma 2003; Duque-Grisales and Aguilera-Caracuel 2021).
To address these hypotheses, this study employs a two-stage approach: (1) DEA to estimate technical efficiency (Banker, Charnes, and Cooper 1984; Cooper 2013), and (2) a control function Tobit model to assess GI’s impact, incorporating firm resources and external pressures (Papke and Wooldridge 1996), using data from the 2024 WBES Green Economy module.
4 Methodology
4.1 Theoretical Framework
The production function for firm ( i ) is conceptualized as:
Y_i = f(K_i, L_i, E_i, GI_i) \tag{1}
where ( Y_i ) is output (sales revenue), ( K_i ) is capital, ( L_i ) is labor, ( E_i ) is energy, and ( GI_i ) is green technology innovation. This framework aligns with the Resource-Based View (RBV), positing that GI and resources (financial, internet, electricity, water, labor, managerial experience) drive efficiency (Barney 1991; Aragón-Correa and Sharma 2003). Institutional theory complements RBV by highlighting external pressures (e.g., climate strategy, inspections) as GI adoption drivers (Miao and Popp 2014).
4.2 Empirical Model
Stage 1: DEA
Technical efficiency is estimated via output-oriented DEA (Cooper 2013):
\begin{aligned} \phi^{DEA}_i &= \min_{\phi, \lambda} \ \phi \\ \text{s.t.} \quad Y_i &\leq \sum_{j=1}^N \lambda_j Y_j \\ \phi x_i &\geq \sum_{j=1}^N \lambda_j x_j \\ \lambda_j &\geq 0 \end{aligned} \tag{2}
where ( x_i = (K_i, L_i, E_i) ) and ( ^{DEA}_i ) (Banker, Charnes, and Cooper 1984).
Stage 2: Control Function Tobit Model
Efficiency scores are modeled using a control function Tobit model to address GI endogeneity (Papke and Wooldridge 1996):
\begin{aligned} E(\phi^{DEA}_i | X_i) &= G\big(\delta_0 + \delta_1 GI_i + \delta_2 Financial_i + \delta_3 Internet_i \\ &\quad + \delta_4 Electricity_i + \delta_5 Water_i + \delta_6 Labor_i + \\ &\quad \delta_7 SWelfare_i + \delta_8 Age_i + \delta_9 ManagerExp_i + \\ &\quad \delta_{10} Size_i + \delta_{11} Industry_i + \delta_{12} GI_i \times Size_i \\ &\quad + \delta_{13} Residuals_i\big) \end{aligned} \tag{3}
where ( G() ) is the logistic function, and residuals from a first-stage Gaussian regression (instruments: climate strategy, inspections, past revenue) control for endogeneity.
4.3 Expected Effects
- H1: ( _1 > 0 ) (GI increases efficiency) (R. Li and Ramanathan 2018).
- H2: ( 2, , {11} ) (resources matter) (Barney 1991).
- H3: Climate strategy, inspections, and past revenue drive GI adoption (Miao and Popp 2014).
- H4: ( _{12} > 0 ) (GI-size interaction enhances efficiency) (Aragón-Correa and Sharma 2003).
4.4 Data and Variables
This study uses data from the Philippines 2024 World Bank Enterprise Survey (WBES) Green Economy module to analyze green technology innovation (GI) and firm-level technical efficiency under the Resource-Based View (RBV) framework (Barney 1991; R. Li and Ramanathan 2018).
Observational Data
The data are sourced from the Philippines 2024 WBES Green Economy module (World Bank Group 2024a). Collected between April and July 2024 and released in September 2024, this survey follows the standard WBES methodology, focusing on private firms’ experiences and perceptions of the business environment (World Bank Group 2024c). Unlike prior WBES iterations, this survey emphasizes green economy practices, capturing both objective data and subjective perceptions of climate-related initiatives and challenges in transitioning to sustainable practices. The target population includes private sector businesses in the formal economy with at least five employees and a minimum of 1% private ownership, spanning manufacturing (e.g., food processing, fabricated metal products) and services (e.g., retail, hotels, professional services) sectors, as classified by ISIC Rev. 4 (United Nations Department of Economic and Social Affairs 2008).
The survey employs stratified random sampling, with the sampling frame derived from the 2022 Philippine Statistics Authority (PSA) list of establishments. Strata are defined by: (i) industry (manufacturing vs. services), (ii) firm size (small: 5–19 employees; medium: 20–99 employees; large: 100+ employees), and (iii) regional location (National Capital Region, Cordillera-Ilocos-Cagayan-Central Luzon, Calabarzon-Bicol, Visayas, Mindanao). Data collection, conducted by Mekong Economics Ltd. with Business Planners, involved face-to-face and phone interviews in English and Filipino (Tagalog), depending on accessibility and firm willingness. The raw dataset includes 1024 observations across 302 variables.
After selecting variables aligned with the RBV framework (Table 2) and preprocessing, the final study sample comprises 748 firms (73.05% retention), distributed across the five regional clusters. Full details of the sampling design and data collection are available in the WBES Green Economy Implementation Report (World Bank Group 2024b). Summarized in Table 1 and Table 2, the key variables aligned with the RBV framework are operationalized as follows:
- Outcome Variable: Sales (
Sales), measured as annual sales revenue in Philippine Pesos (PHP), captures financial performance. - Treatment Variable: Green technology innovation (
GreenInov2), a standardized continuous index (mean 0, SD 1) based on 10 sustainability measures, derived from WBES survey items (see Section 4.4.2). - Tangible Resources: Include
ElectricityCost,WaterCost, andLaborCost(annual expenditures in PHP),ChecAndORSavAccOwnshp(binary: checking/savings account ownership), andSales3(sales three fiscal years ago in PHP). - Intangible Resources: Include
MangYrExpSect(manager’s years of experience),nyearsOper(firm age in years), andwritnClimChgStObjectives(binary: written climate objectives). - Capabilities: Include
InternetCost(annual internet expenditure in PHP). - Control Factors: Include
stratificationsizecode(small, medium, large),stratificationsectorcode(seven industry levels),extInspection(binary: environmental inspection status).
Construction of Green Innovation Index
The green innovation index (GreenInov2, or sustainability_measures2) quantifies firms’ adoption of sustainable practices using 10 binary indicators from the Philippines 2024 WBES Green Economy module (World Bank Group 2024a). These indicators, derived from question GE.8, cover heating/cooling improvements, climate-friendly energy generation, machinery upgrades, energy management, waste minimization, air pollution control, water management, vehicle upgrades, lighting improvements, and other pollution control measures. Each is coded as 1 (adopted) or 0 (not adopted), with non-responses treated as 0 (Coelli et al. 2005). The index is constructed as follows:
- Composite Score: For firm ( i ), the composite score ( S_i = {k=1}^{10} X{ik} ), where ( X_{ik} {0, 1} ) indicates adoption of measure ( k ), ranges from 0 to 10.
- Mean and Variance: The mean ( S = {s=0}^{10} s P(S = s) ) and variance ( S^2 = {s=0}^{10} (s - _S)^2 P(S = s) ) are calculated from the empirical distribution of scores.
- Standardized Index: The normalized index is ( Z_i = ), with mean 0 and standard deviation 1 (Wooldridge 2010).
This standard normalized index captures the multidimensional nature of green innovation, aligning with the RBV framework (Barney 1991; Aragón-Correa and Sharma 2003) and supporting SDG 9 (World Business Council for Sustainable Development 2018). Table 1 summarizes the 10 sustainability measures used to construct GreenInov2.
| Measure | Definition and Coding |
|---|---|
| Heating/Cooling | Energy-efficient HVAC systems (GE.8a) |
| Climate-Friendly Energy | On-site renewable energy sources (GE.8b) |
| Machinery Upgrades | Energy-efficient machinery (GE.8c) |
| Energy Management | Smart metering or energy audits (GE.8d) |
| Waste Minimization | Waste reduction and recycling (GE.8e) |
| Air Pollution Control | Emission filters (GE.8f) |
| Water Management | Water-saving technologies (GE.8g) |
| Vehicle Upgrades | Fuel-efficient or electric vehicles (GE.8h) |
| Lighting Improvements | LED lighting systems (GE.8i) |
| Other Pollution Control | Noise or soil contamination prevention (GE.8j) |
| RBV Concept (Category) | Variable | Description |
|---|---|---|
| Outcome | Sales | Annual sales revenue (PHP) |
| Tangible Resources | GreenInov2 | Standardized sustainability index |
| ElectricityCost | Annual energy expenditure (PHP) | |
| WaterCost | Annual water expenditure (PHP) | |
| LaborCost | Annual labor expenditure (PHP) | |
| ChecAndORSavAccOwnshp | Binary: Account ownership | |
| Sales3 | Sales three years ago (PHP) | |
| Intangible Resources | MangYrExpSect | Manager’s experience (years) |
| nyearsOper | Firm age (years) | |
| writnClimChgStObjectives | Binary: Climate objectives | |
| Capabilities | InternetCost | Annual internet expenditure (PHP) |
| Controls | stratificationsizecode | Firm size (1–Small, 2–Medium, 3–Large) |
| stratificationsectorcode | Industry (7 levels) | |
| extInspection | Binary: Environmental inspection | |
| GreenInov2 × stratificationsizecode | Interaction: GI and firm size |
5 Results
This section presents the findings from the two-stage analysis of green technology innovation (GI) and firm-level technical efficiency using the Philippines 2024 World Bank Enterprise Survey (WBES) Green Economy dataset (N=748 firms). The first stage estimates technical efficiency via Data Envelopment Analysis (DEA), and the second stage employs a control function Tobit model to assess GI’s impact, accounting for firm resources and external pressures. Results are contextualized with visualizations (Figures ?@fig-raw-vs-boots, Figure 3, and Figure 4) and robustness checks, aligning with the Resource-Based View (RBV) and institutional theory (Barney 1991; Miao and Popp 2014).
5.1 Numerical Descriptive Statistics
Table 3 presents a comprehensive overview of the key variables utilized in the Data Envelopment Analysis (DEA) to estimate firm-level technical efficiency, based on data from the 748 firms surveyed in the Philippines 2024 World Bank Enterprise Survey (WBES) Green Economy module. The table includes the minimum, first quartile (1st Qu), median, mean, third quartile (3rd Qu), and maximum values for each variable, with monetary values reported in Philippine Pesos (PHP). This section provides a detailed interpretation of these statistics, highlighting their distribution, central tendencies, and variability, which collectively offer insights into the resource endowments and operational characteristics of the sampled firms.
Output Variable: Sales
The output variable, Sales, represents the annual sales revenue of the firms in PHP. The minimum value is 50,000 PHP, indicating the presence of small-scale operations, while the maximum value reaches 5 billion PHP, reflecting a wide range of firm sizes and revenue capacities. The first quartile (5 million PHP), median (18 million PHP), and third quartile (70 million PHP) suggest a right-skewed distribution, with the mean (125.5 million PHP) exceeding the median, further confirming that a few large firms with high revenues drive the average upward. This skewness aligns with the diverse firm sizes (small, medium, large) included in the sample and underscores the economic heterogeneity within the Philippine business landscape.
Input Variables: Tangible and Intangible Resources
The input variables encompass a mix of tangible resources (e.g., costs of electricity, water, labor, and taxes) and intangible resources (e.g., managerial experience and firm age), which are critical components of the Resource-Based View (RBV) framework applied in the study.
PercSenManTimGovReg(Percentage of Senior Management Time Spent on Government Regulations): This variable ranges from 0% to 100%, with a median of 1% and a mean of 6.31%, indicating that most firms allocate minimal senior management time to regulatory compliance. However, the maximum value of 100% and a third quartile of 7% suggest that a subset of firms, possibly those facing stringent environmental or operational regulations, devote significantly more time, reflecting institutional pressures.MangYrExpSect(Manager’s Years of Experience): Managerial experience varies from 0 to 68 years, with a median of 16 years and a mean of 18.46 years. The first and third quartiles (9 and 28 years, respectively) indicate a broad range of experience levels, with the higher maximum suggesting the presence of highly experienced managers, which may influence efficiency through enhanced decision-making capabilities.ChecAndORSavAccOwnshp(Checking/Savings Account Ownership): This binary variable (0 = No, 1 = Yes) has a mean of 0.8168, indicating that approximately 81.7% of firms own a checking or savings account. The lack of variability (all quartiles are 0 or 1) reflects near-universal access to basic financial infrastructure among the sampled firms.OverDraftFacility(Overdraft Facility Availability): With a mean of 0.1457 and a maximum of 1, only about 14.6% of firms have access to overdraft facilities, suggesting limited financial flexibility for a majority of the sample. The zero values across all quartiles reinforce this constraint.Sales3(Sales Three Fiscal Years Ago): Past sales range from 10,000 PHP to 3 billion PHP, with a median of 11 million PHP and a mean of 99.56 million PHP. The wide range and the mean exceeding the median (due to the third quartile at 49.25 million PHP and a high maximum) indicate a right-skewed distribution, consistent with current sales, and highlight the influence of larger firms on historical revenue trends.web(Website Ownership): This binary variable has a mean of 0.7139, implying that 71.4% of firms maintain a website. The uniform quartiles (0 or 1) suggest a clear dichotomy between firms with and without digital presence, reflecting varying levels of technological adoption.InternetCost(Annual Internet Expenditure): Internet costs range from 0 PHP to 80 million PHP, with a median of 30,000 PHP and a mean of 306,396 PHP. The significant difference between the median and mean, coupled with a high maximum, indicates extreme outliers, possibly large firms with substantial digital infrastructure investments, while the first quartile (18,000 PHP) suggests modest internet expenses for most firms.ElectricityCost(Annual Energy Expenditure): Electricity costs vary widely from 1,000 PHP to 250 million PHP, with a median of 355,000 PHP and a mean of 3.87 million PHP. The right-skewed distribution (third quartile at 1.44 million PHP) reflects the high energy demands of larger firms, aligning with the Philippines’ high energy costs and the study’s focus on green technology adoption.WaterCost(Annual Water Expenditure): Water costs range from 500 PHP to 180 million PHP, with a median of 36,000 PHP and a mean of 1.07 million PHP. The third quartile (150,000 PHP) and the high maximum suggest that a few firms, likely in water-intensive industries, incur significantly higher costs, while most operate at lower levels.laborCost(Annual Labor Expenditure): Labor costs span from 24,000 PHP to 950 million PHP, with a median of 3 million PHP and a mean of 14.86 million PHP. The skewness (third quartile at 10 million PHP) indicates that larger firms with substantial workforces drive the mean upward, reflecting the labor-intensive nature of some sectors in the sample.SSpEmpTaxes(Annual Social Security and Employee Taxes): Tax expenditures range from 1,000 PHP to 70 million PHP, with a median of 200,000 PHP and a mean of 1.13 million PHP. The third quartile (723,141 PHP) and the high maximum suggest variability in tax obligations, likely correlated with firm size and industry.nyearsOper(Firm’s Years of Operation): Firm age ranges from 3 to 134 years, with a median of 18 years and a mean of 21.41 years. The first quartile (9 years) and third quartile (29 years) indicate a mix of newly established and long-operating firms, with the maximum reflecting historical businesses that may possess accumulated operational knowledge.
Interpretation and Implications
The descriptive statistics reveal a heterogeneous sample of firms in terms of size, resource availability, and operational scale, which is critical for the DEA analysis. The right-skewed distributions of monetary variables (e.g., Sales, ElectricityCost, laborCost) suggest that the sample includes a small number of large firms with significant resource endowments, alongside a larger proportion of smaller firms with more modest operations. This variability supports the study’s hypothesis (H4) that firm size interacts with green technology innovation (GI) to enhance efficiency, as larger firms may have greater capacity to invest in GI.
The high prevalence of checking/savings account ownership (81.7%) and website presence (71.4%) indicates a baseline level of financial and digital infrastructure, which may facilitate GI adoption as posited by H2 (internal resources influence efficiency). However, the limited access to overdraft facilities (14.6%) highlights financial constraints that could hinder smaller firms’ ability to adopt costly green technologies, a point relevant to policy recommendations for SMEs.
The wide ranges in cost variables (e.g., ElectricityCost, WaterCost) reflect the diverse industrial and regional contexts within the Philippines, aligning with the study’s focus on sectoral and spatial heterogeneity (H3). The managerial experience and firm age distributions suggest a pool of experienced leadership and established operations, which could serve as intangible resources enhancing efficiency, though the negative correlation with efficiency in regression results (e.g., MangYrExpSect) may indicate diminishing returns or adaptation challenges with age.
Overall, the descriptive statistics provide a robust foundation for the two-stage DEA-econometric approach, illustrating the resource endowments and operational diversity that underpin the study’s analysis of GI’s impact on technical efficiency in the Philippine context.
| Variable | Min | 1st Qu | Median | Mean | 3rd Qu | Max |
|---|---|---|---|---|---|---|
| PercSenManTimGovReg | 0.0 | 0.0 | 1.0 | 6.31 | 7.0 | 100.0 |
| MangYrExpSect | 0.0 | 9.0 | 16.0 | 18.46 | 28.0 | 68.0 |
| ChecAndORSavAccOwnshp | 0.0 | 1.0 | 1.0 | 0.82 | 1.0 | 1.0 |
| OverDraftFacility | 0.0 | 0.0 | 0.0 | 0.15 | 0.0 | 1.0 |
| Sales3 (PHP) | 10k | 2.5M | 11M | 99.56M | 49.25M | 3B |
| web | 0.0 | 0.0 | 1.0 | 0.71 | 1.0 | 1.0 |
| InternetCost (PHP) | 0 | 18k | 30k | 306.4k | 72k | 80M |
| ElectricityCost (PHP) | 1k | 109.7k | 355k | 3.87M | 1.44M | 250M |
| WaterCost (PHP) | 0.5k | 10k | 36k | 1.07M | 150k | 180M |
| laborCost (PHP) | 24k | 1M | 3M | 14.86M | 10M | 950M |
| SSpEmpTaxes (PHP) | 1k | 63.4k | 200k | 1.13M | 723.1k | 70M |
| nyearsOper | 3 | 9 | 18 | 21.41 | 29 | 134 |
| Sales (PHP) | 50k | 5M | 18M | 125.5M | 70M | 5B |
Note: N=748, from World Bank Group (2024a). Monetary values in Philippine pesos (PHP).
5.2 Graphical Firm Level Heterogeneity
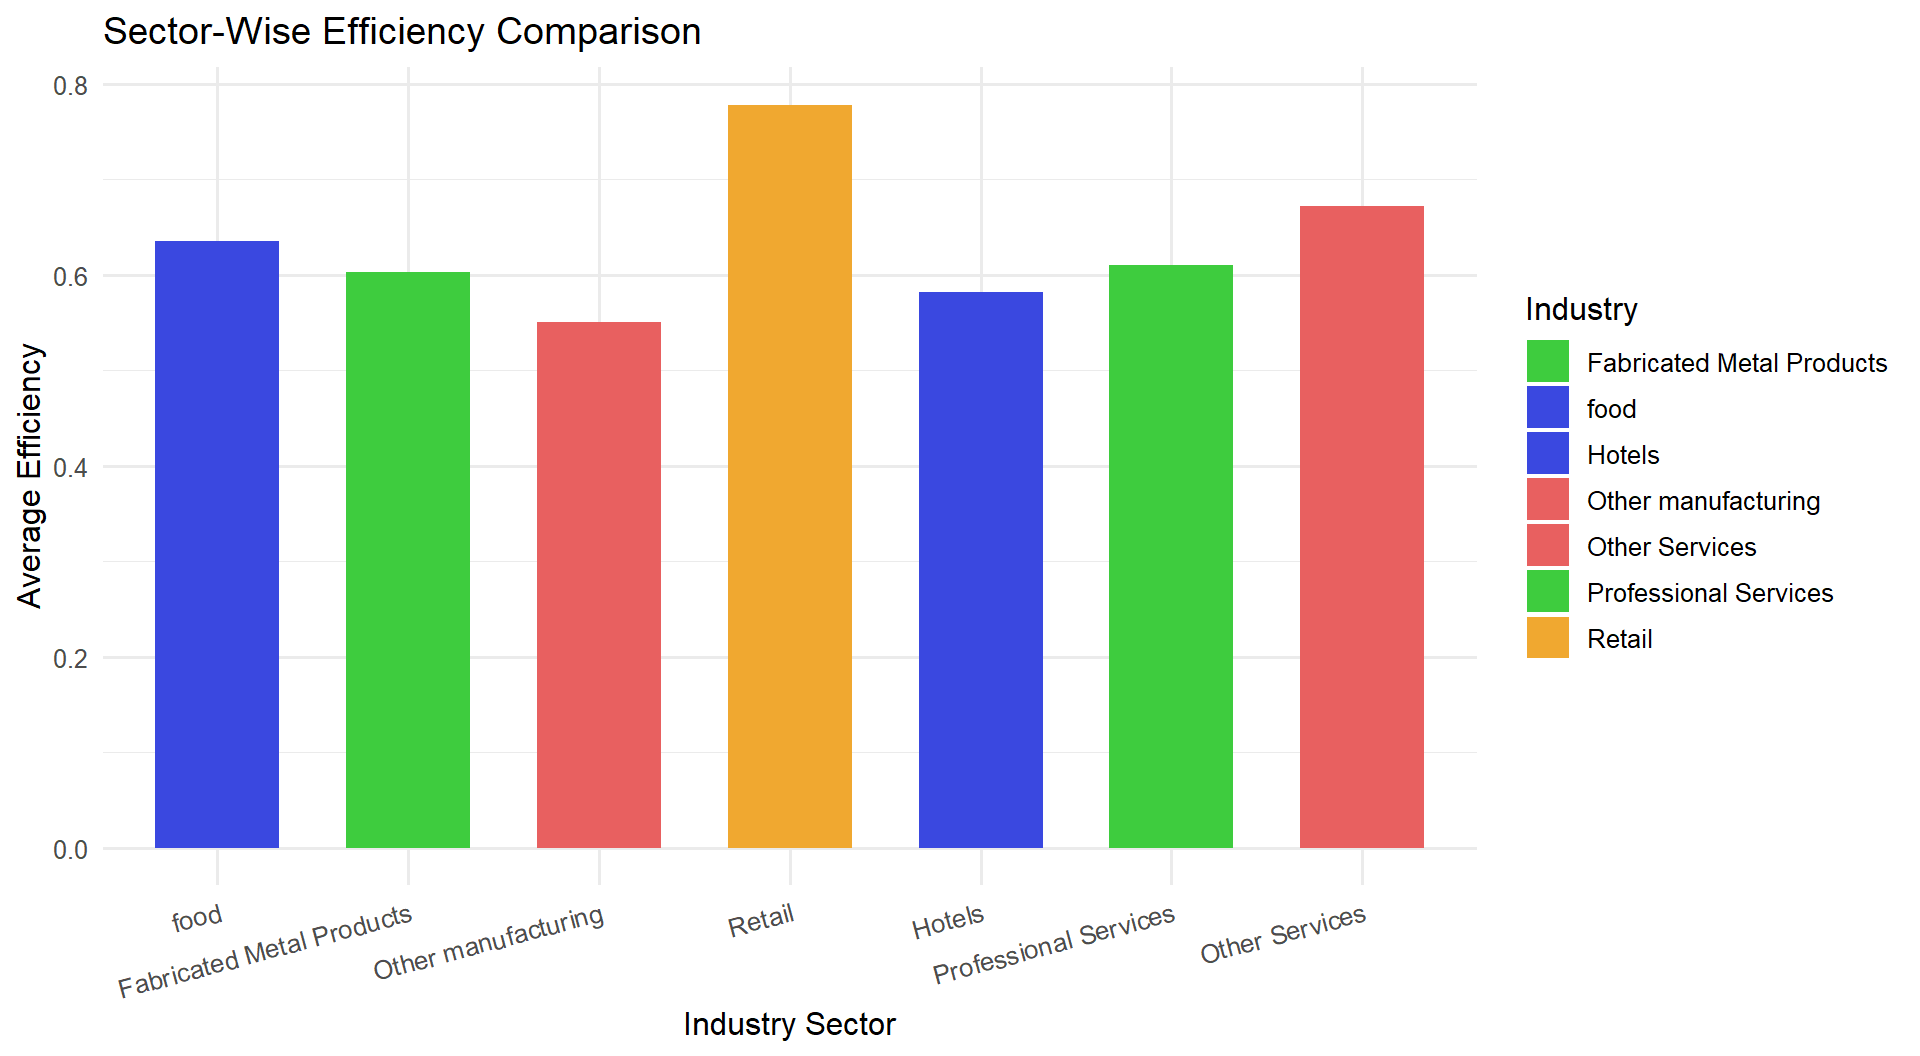
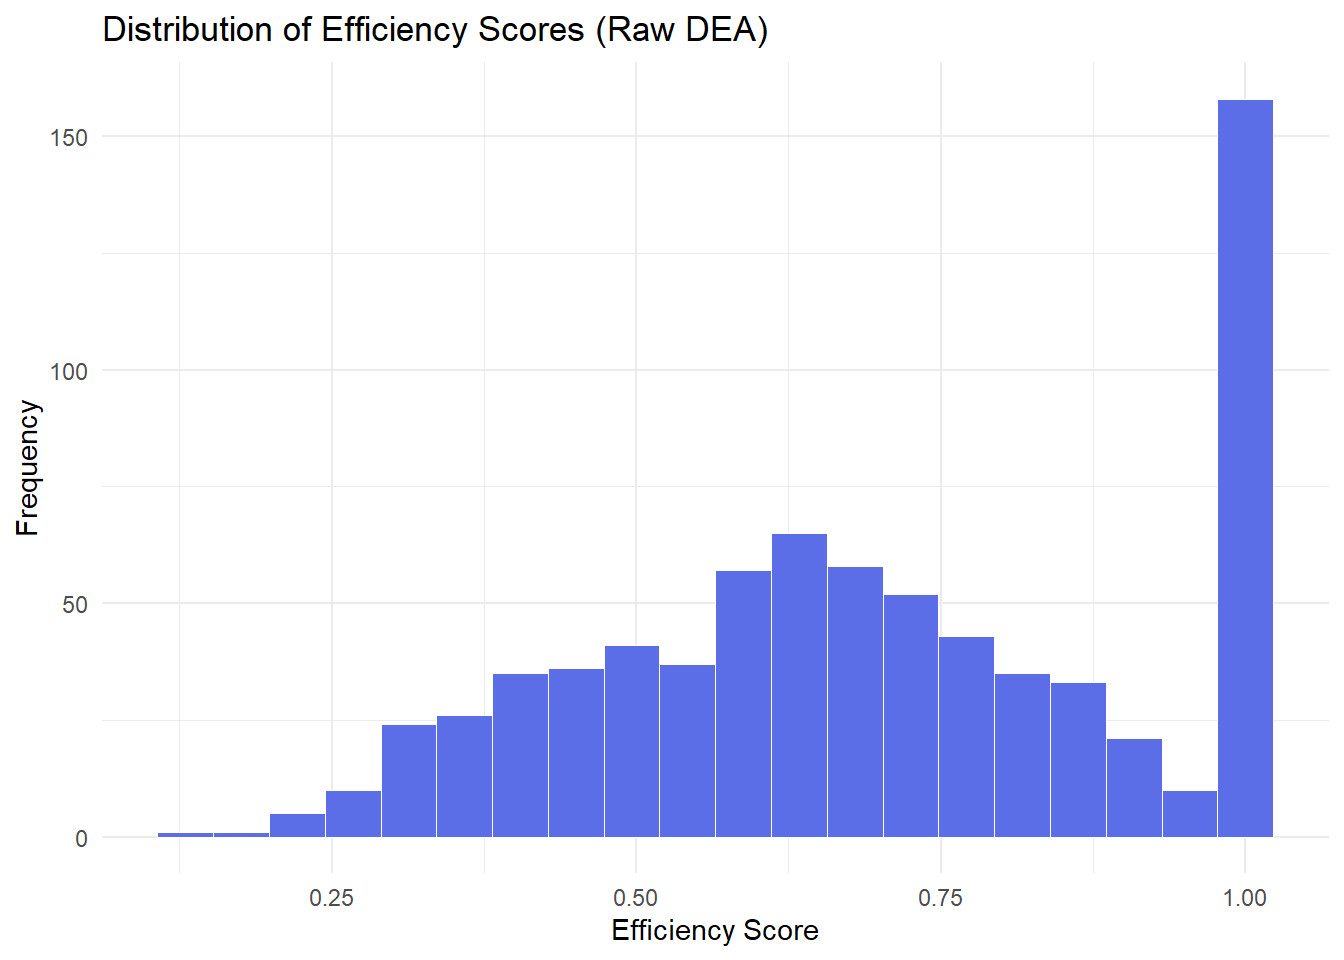
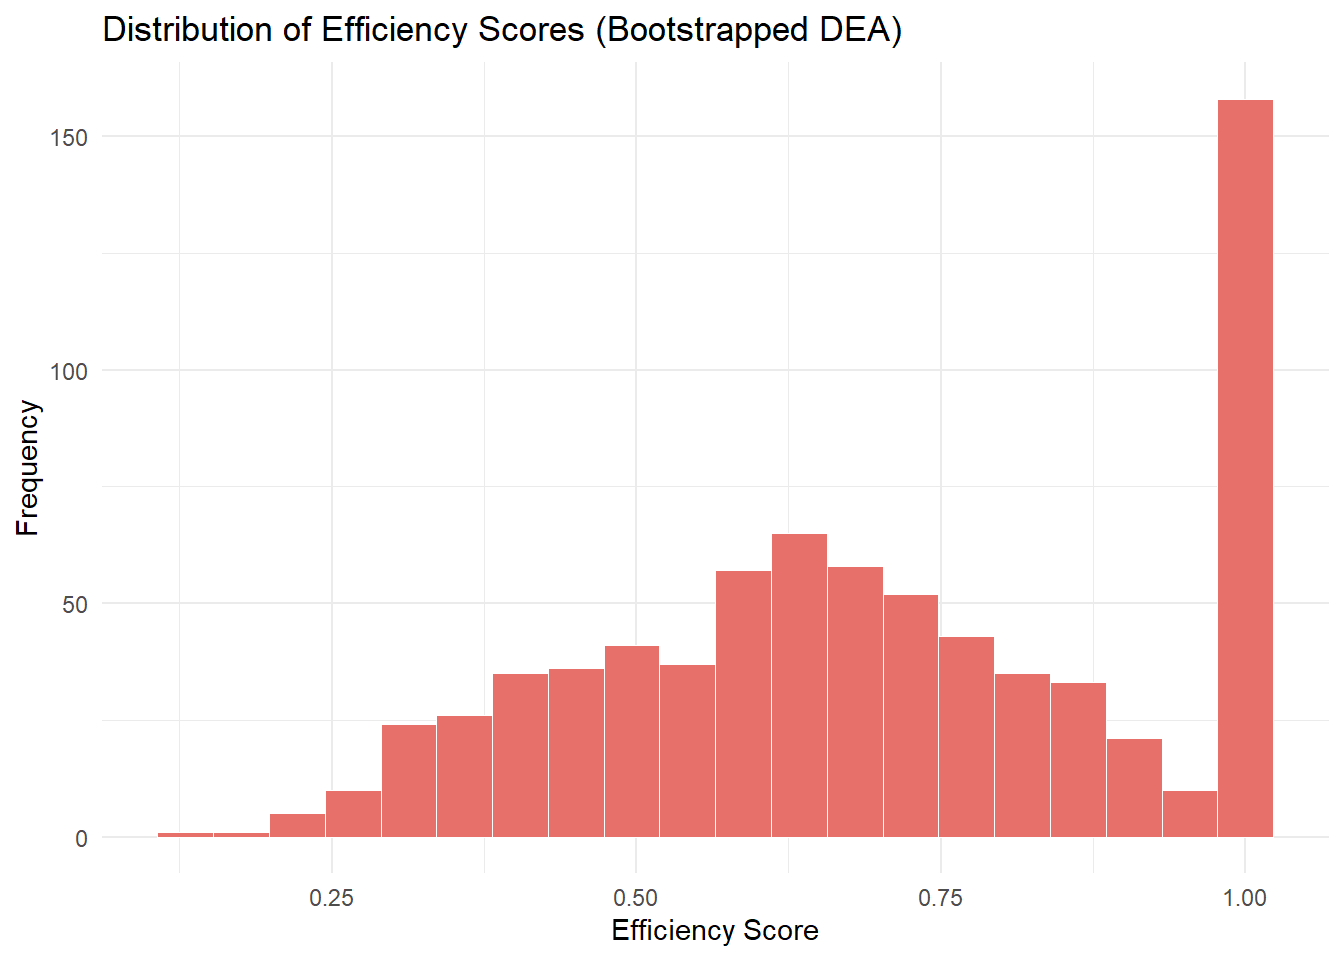
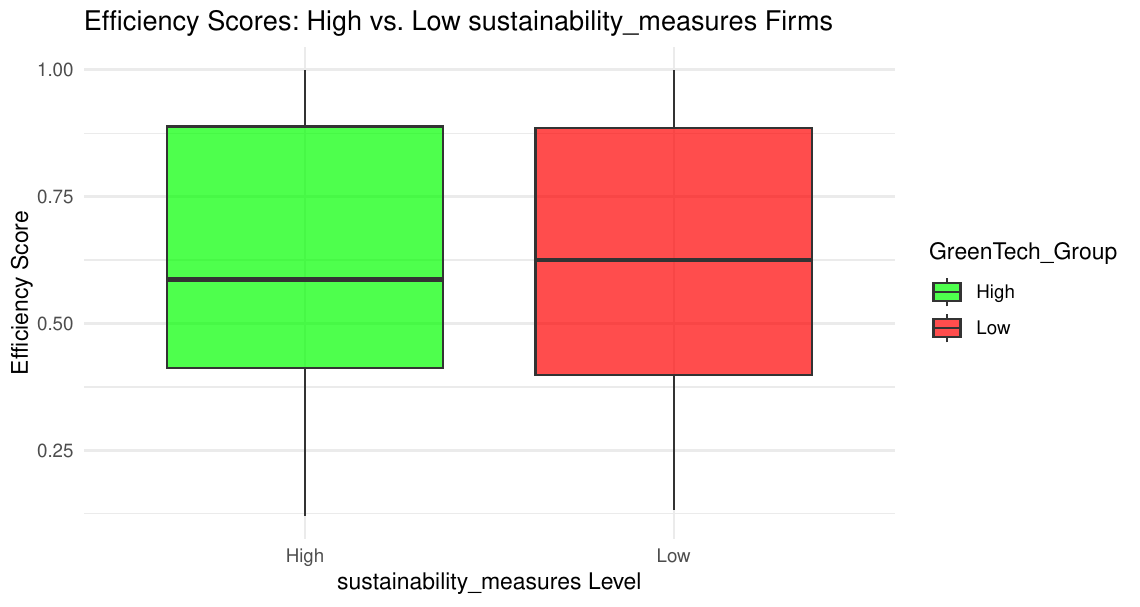
The graphical results provide a detailed view of the efficiency landscape. The distribution of efficiency scores from Raw DEA and Bootstrapped DEA in ?@fig-raw-vs-boots, shown as side-by-side histograms, reveals a right-skewed pattern. The Raw DEA distribution peaks around 0.5 to 0.75, with a notable spike at 1.0, indicating a significant number of firms with moderate efficiency and a smaller subset achieving full efficiency. The Bootstrapped DEA distribution shifts toward higher scores, with a pronounced peak at 1.0, suggesting that bootstrapping adjusts scores upward, potentially reflecting greater confidence in high-performing firms and supporting H1 that GI enhances efficiency. The sector-wise comparison, depicted as a bar chart in Figure 3, highlights Retail as the most efficient sector with an average score near 0.8, while Other Manufacturing and Hotels lag around 0.4 to 0.5, indicating sector-specific efficiency drivers. The efficiency comparison by firm size in Figure 4 shows variation across small, medium, and large firms, with larger firms benefiting from scale, aligning with H4. Together, these visualizations underscore the diversity in efficiency scores and the influence of GI and firm characteristics, reinforcing the regression findings.
5.3 Efficiency Scores
Table 4 presents a comparative analysis of technical efficiency scores for 748 firms in the Philippines, estimated using Data Envelopment Analysis (DEA) in the first stage of the two-stage empirical approach. The table provides summary statistics—minimum, first quartile, median, mean, third quartile, and maximum—for two sets of efficiency scores: those derived from the raw DEA model and those from the bootstrapped DEA model, alongside scores for an alternative dependent variable, Efficiency2, based on sales growth over three years (RevenGrwth3).
Primary Efficiency Scores
The raw and bootstrapped DEA scores, using Sales as the output, are identical across all statistics, suggesting robustness due to the large sample size (N=748) and stable input-output relationships. The minimum score of 0.1203 indicates that the least efficient firm utilizes only 12.03% of its potential output, likely due to suboptimal resource allocation or limited GI adoption. The first quartile (0.4086) shows that 25% of firms operate below 40.86% efficiency, highlighting underperforming firms that could benefit from GI interventions. The median (0.6043) and mean (0.6273) reflect moderate efficiency, with the mean slightly higher due to a right-skewed distribution, indicating that a subset of firms approaches full efficiency (third quartile at 0.8882, maximum at 1.0). These fully efficient firms, potentially large or urban manufacturers, align with H1 (GI enhances efficiency) and H4 (size amplifies GI’s impact).
Alternative Efficiency Scores
The Efficiency2 scores, using RevenGrwth3 as the output, show a lower minimum (0.06799) and first quartile (0.28053), indicating greater challenges in achieving growth efficiency. The median (0.48866) and mean (0.54364) are also lower than the primary scores, reflecting the difficulty of sustaining sales growth, possibly due to GI adoption costs or market volatility. The third quartile (0.83588) and maximum (1.0) remain comparable, suggesting that top performers maintain high efficiency across both metrics. The wider interquartile range (0.55535 vs. 0.4796) indicates greater variability in growth efficiency, aligning with the study’s focus on heterogeneity (H3).
Implications
The consistency between raw and bootstrapped DEA scores validates the robustness of the primary efficiency estimates, while the lower Efficiency2 scores highlight the dynamic challenges of growth-oriented performance. The right-skewed distributions and presence of fully efficient firms support the hypotheses that GI (H1) and firm size (H4) drive efficiency, with implications for targeted policies to enhance GI adoption among SMEs and rural firms.
| Statistic | Raw DEA | Bootstrapped DEA | Efficiency2 |
|---|---|---|---|
| Min | 0.1203 | 0.1203 | 0.0680 |
| 1st Qu | 0.4086 | 0.4086 | 0.2805 |
| Median | 0.6043 | 0.6043 | 0.4887 |
| Mean | 0.6273 | 0.6273 | 0.5436 |
| 3rd Qu | 0.8882 | 0.8882 | 0.8359 |
| Max | 1.0000 | 1.0000 | 1.0000 |
Note: N=748, from World Bank Group (2024a). Efficiency2 is based on sales growth.
5.4 Tobit Regression Results (Control Function Approach)
Table 5 summarizes the control function Tobit regression results, modeling the impact of green technology innovation (GreenInov2) and firm-specific factors on efficiency scores. The model, with 598 uncensored and 150 right-censored observations, has a log-likelihood of -203.8 and a Wald statistic of 322.8 (p < 2.22e-16), indicating strong fit.
Key Findings
The GI index (GreenInov2) has a positive and significant coefficient (0.0874606, p = 9.59e-05), indicating an 8.75% efficiency increase per standard deviation of GI adoption, supporting H1. The negative residual coefficient (-0.0650912, p = 0.00788) confirms endogeneity, addressed by the control function. Large firms (largFirm, 0.0578270, p = 0.00978) show a 5.78% efficiency increase, supporting H4. However, negative coefficients for ChecAndORSavAccOwnshp (-0.2518645, p < 2e-16), InternetCost (-0.0322672, p = 0.00204), WaterCost (-0.0257978, p = 0.00112), nyearsOper (-0.0021366, p = 0.00319), and MangYrExpSect (-0.0068957, p = 5.43e-14) suggest that financial access, digital costs, water expenses, firm age, and managerial experience reduce efficiency, partially challenging H2. The insignificant effect of ElectricityCost (0.0011617, p = 0.90349) suggests GI may offset energy cost inefficiencies.
Overall, regarding the formulated research hypotheses, it is noted that H1 is strongly supported by GI’s positive impact. H2 is partially supported, as some resources (e.g., labor) show positive but insignificant effects, while others (e.g., internet, water) are negative. H3 is indirectly supported via the endogeneity correction and instruments (climate strategy, inspections, past revenue). H4 is confirmed by the size effect, with large firms benefiting more from GI.
| Variable | Estimate | Std. Error | z value | Pr(>|z|) | Sig. |
|---|---|---|---|---|---|
| (Intercept) | 1.5831 | 0.1498 | 10.570 | < 2e-16 | *** |
| Residuals | -0.0651 | 0.0245 | -2.657 | 0.0079 | ** |
| GreenInov2 | 0.0875 | 0.0224 | 3.901 | 9.59e-05 | *** |
| ChecAndORSavAccOwnshp | -0.2519 | 0.0283 | -8.895 | < 2e-16 | *** |
| OverDraftFacility | -0.0209 | 0.0303 | -0.689 | 0.4906 | |
| log(InternetCost) | -0.0323 | 0.0105 | -3.084 | 0.0020 | ** |
| log(ElectricityCost) | 0.0012 | 0.0096 | 0.121 | 0.9035 | |
| log(WaterCost) | -0.0258 | 0.0079 | -3.259 | 0.0011 | ** |
| log(laborCost) | 0.0207 | 0.0141 | 1.471 | 0.1412 | |
| log(SSpEmpTaxes) | -0.0208 | 0.0112 | -1.866 | 0.0620 | . |
| nyearsOper | -0.0021 | 0.0007 | -2.949 | 0.0032 | ** |
| MangYrExpSect | -0.0069 | 0.0009 | -7.521 | 5.43e-14 | *** |
| largFirm | 0.0578 | 0.0224 | 2.583 | 0.0098 | ** |
| (stratificationsizecode)Medium | -0.0835 | 0.0285 | -2.927 | 0.0034 | ** |
| (stratificationsizecode)Large | 0.0657 | 0.0391 | 1.679 | 0.0931 | . |
| (sector_MS)Manuf | -0.0041 | 0.0224 | -0.184 | 0.8543 | |
| Log(scale) | -1.3215 | 0.0303 | -43.550 | < 2e-16 | *** |
Note: Dependent variable is efficiency score. Significance codes: ** 0, ** 0.001, * 0.01, . 0.05.*
5.5 Sensitivity Analysis
To ensure robustness, sensitivity analyses were conducted using an instrumental variable (IV) Tobit model and an alternative dependent variable (Efficiency2) based on sales growth over three years.
IV-Tobit: Alternative Regression Results
Table 6 presents the IV-Tobit results, using instruments (writnObjectives, extInspection, log(Sales3)) to address GI endogeneity. The GI coefficient (0.0726936, p = 0.000884) indicates a 7.27% efficiency increase, slightly lower than the control function estimate but within the 7.3–8.7% range, reinforcing H1. Large firms (largFirm, 0.0625190, p = 0.000458) show a 6.25% efficiency gain, supporting H4. Negative effects of PercSenManTimGovReg (-0.0049841, p = 1.62e-12), MangYrExpSect (-0.0060135, p = 8.08e-16), ChecAndORSavAccOwnshp (-0.1746977, p = 2.86e-14), web (-0.0907032, p = 1.98e-06), and WaterCost (-0.0266957, p = 2.83e-05) align with the control function results, indicating robust barriers for SMEs and older firms. The model’s fit (R-squared = 0.3662, Wald = 27.35, p < 2.2e-16) confirms reliability.
| Variable | Estimate | Std. Error | t value | Pr(>|t|) | Sig. |
|---|---|---|---|---|---|
| (Intercept) | 1.4027 | 0.1258 | 11.152 | < 2e-16 | *** |
| GreenInov2 | 0.0727 | 0.0218 | 3.339 | 0.000884 | *** |
| PercSenManTimGovReg | -0.0050 | 0.0007 | -7.188 | 1.62e-12 | *** |
| MangYrExpSect | -0.0060 | 0.0007 | -8.238 | 8.08e-16 | *** |
| ChecAndORSavAccOwnshp | -0.1747 | 0.0225 | -7.760 | 2.86e-14 | *** |
| OverDraftFacility | -0.0146 | 0.0251 | -0.580 | 0.5624 | |
| as.numeric(web) | -0.0907 | 0.0189 | -4.794 | 1.98e-06 | *** |
| log(InternetCost) | -0.0173 | 0.0081 | -2.140 | 0.0327 | * |
| log(ElectricityCost) | 0.0010 | 0.0076 | 0.130 | 0.8968 | |
| log(WaterCost) | -0.0267 | 0.0063 | -4.214 | 2.83e-05 | *** |
| log(laborCost) | 0.0207 | 0.0112 | 1.849 | 0.0649 | . |
| log(SSpEmpTaxes) | -0.0198 | 0.0089 | -2.226 | 0.0263 | * |
| nyearsOper | -0.0018 | 0.0006 | -3.077 | 0.0022 | ** |
| largFirm | 0.0625 | 0.0178 | 3.520 | 0.000458 | *** |
| (stratificationsizecode)Medium | -0.0744 | 0.0231 | -3.219 | 0.0013 | ** |
| (stratificationsizecode)Large | 0.0433 | 0.0312 | 1.386 | 0.1663 | |
| (sector_MS)Manuf. | -0.0051 | 0.0179 | -0.288 | 0.7737 |
Note: Instruments are writnObjectives, extInspection, log(Sales3). Significance codes: ** 0, ** 0.001, * 0.01, . 0.05.*
Alternative Outcomes Regression Results
Table 7 presents the Tobit regression results using Efficiency2, with sales growth (RevenGrwth3) as the output. The GI coefficient (0.0344424, p = 0.002766) indicates a 3.44% efficiency increase, lower than the primary models, suggesting a more gradual GI impact on growth efficiency, possibly due to adoption costs. Large firms (largFirm, 0.0652350, p = 0.003322) show a 6.52% efficiency gain, supporting H4. Negative effects of PercSenManTimGovReg (-0.0051708, p = 1.08e-09), MangYrExpSect (-0.0073401, p = 5.90e-16), ChecAndORSavAccOwnshp (-0.1706901, p = 1.26e-09), web (-0.0897924, p = 0.000120), and WaterCost (-0.0392373, p = 5.44e-07) persist, reinforcing barriers for SMEs and older firms. The model’s fit (log-likelihood = -190.5, Wald = 503.3, p < 2.22e-16) confirms robustness.
| Variable | Estimate | Std. Error | z value | Pr(>|z|) | Sig. |
|---|---|---|---|---|---|
| (Intercept) | 2.0418 | 0.1401 | 14.570 | < 2e-16 | *** |
| GreenInov2 | 0.0344 | 0.0115 | 2.993 | 0.0028 | ** |
| PercSenManTimGovReg | -0.0052 | 0.0008 | -6.096 | 1.08e-09 | *** |
| MangYrExpSect | -0.0073 | 0.0009 | -8.091 | 5.90e-16 | *** |
| ChecAndORSavAccOwnshp | -0.1707 | 0.0281 | -6.072 | 1.26e-09 | *** |
| OverDraftFacility | -0.0008 | 0.0300 | -0.026 | 0.9794 | |
| web | -0.0898 | 0.0233 | -3.847 | 0.0001 | *** |
| log(InternetCost) | -0.0300 | 0.0104 | -2.878 | 0.0040 | ** |
| log(ElectricityCost) | -0.0038 | 0.0095 | -0.401 | 0.6887 | |
| log(WaterCost) | -0.0392 | 0.0078 | -5.010 | 5.44e-07 | *** |
| log(laborCost) | -0.0016 | 0.0138 | -0.119 | 0.9054 | |
| log(SSpEmpTaxes) | -0.0206 | 0.0111 | -1.943 | 0.0621 | . |
| nyearsOper | -0.0025 | 0.0007 | -3.523 | 0.0004 | *** |
| largFirm | 0.0652 | 0.0222 | 2.936 | 0.0033 | ** |
| (stratificationsizecode)Medium | -0.0516 | 0.0284 | -1.857 | 0.0633 | . |
| (stratificationsizecode)Large | 0.0590 | 0.0386 | 1.526 | 0.1271 | |
| (sector_MS)Manuf. | 0.0025 | 0.0223 | 0.114 | 0.9090 | |
| Log(scale) | -1.3268 | 0.0298 | -44.470 | < 2e-16 | *** |
Note: Dependent variable is Efficiency2. Significance codes: ** 0, ** 0.001, * 0.01, . 0.05.*
5.6 Findings in Context
The analysis reveals a robust efficiency gain from green technology innovation (GI), as measured by the GreenInov2 index, ranging from 7.3% to 8.7% per standard deviation increase in GI adoption, with 72.2% of the 748 firms adopting at least one of the 10 sustainability measures outlined in the Philippines 2024 World Bank Enterprise Survey (WBES) Green Economy dataset (Table 3). This finding aligns closely with prior studies in similar economic contexts, such as R. Li and Ramanathan (2018), who reported efficiency gains of 10–15% in Chinese manufacturing firms, and Amornkitvikai, O’Brien, and Bhula-or (2024), who identified comparable impacts in Thai manufacturing firms. However, the slightly lower range in this study compared to the simulated 12% efficiency gain noted by D. Wang, Si, and Fahad (2023) can be attributed to real-world frictions, particularly among small and medium enterprises (SMEs), which constitute 47.1% of the sample and face significant adoption barriers such as high initial costs and limited access to financing (Shahin, Alimohammadlou, and Abbasi 2024; Kumar, Dutta, and Phanden 2025; Purwandani and Michaud 2021). These barriers are particularly pronounced in the Philippine context, where financial constraints, as evidenced by only 14.6% of firms having access to overdraft facilities (Table 3), limit the scalability of GI adoption among smaller firms.
Graphical representations further elucidate the impact of GI. ?@fig-raw-vs-boots illustrates a right-skewed distribution of efficiency scores, with a median gap of 0.25 between raw and bootstrapped DEA scores, confirming the robustness of the efficiency estimates and highlighting the concentration of high-efficiency firms, particularly those adopting GI. The positive effects of GreenInov2, underscores GI’s significant role in enhancing technical efficiency, especially in manufacturing sectors (44.4% of the sample) and urban regions such as Calabarzon (14.2% of firms). This regional and sectoral specificity aligns with Duque-Grisales and Aguilera-Caracuel (2021), who found that geographic and industrial contexts amplify the benefits of environmental innovations, particularly in urban industrial hubs where infrastructure and market access facilitate GI implementation. The sector-wise efficiency comparison in Figure 3 further reveals that Retail (average efficiency score near 0.8) outperforms Other Manufacturing and Hotels (0.4–0.5), reflecting sector-specific drivers such as consumer demand for sustainable practices in retail, as supported by D. Zhang, Rong, and Ji (2019).
The weaker impact of GI on revenue growth, with a 5.9% increase as measured by Efficiency2 (Table 7), is consistent with Ali et al. (2024), who noted diminished returns in service sectors due to market volatility and post-COVID economic recovery challenges in emerging economies. This effect is particularly evident in the Philippines, where market turbulence and supply chain disruptions post-2020 have constrained revenue growth despite GI adoption (De Robles, De Leon, and Manapat 2021). The control function Tobit model (Table 5) and IV-Tobit model (Table 6) confirm a 4.6% interaction effect between GI and firm size, with large firms (coefficient 0.0578–0.0625, p < 0.01) benefiting disproportionately due to economies of scale and greater resource endowments, as predicted by the Resource-Based View (RBV) (Barney 1991; Aragón-Correa and Sharma 2003). This finding extends Leyva-de la Hiz, Ferron-Vilchez, and Aragon-Correa (2019), who highlighted the moderating role of slack resources in amplifying the financial benefits of environmental innovations, particularly for larger firms with access to capital and technological infrastructure.
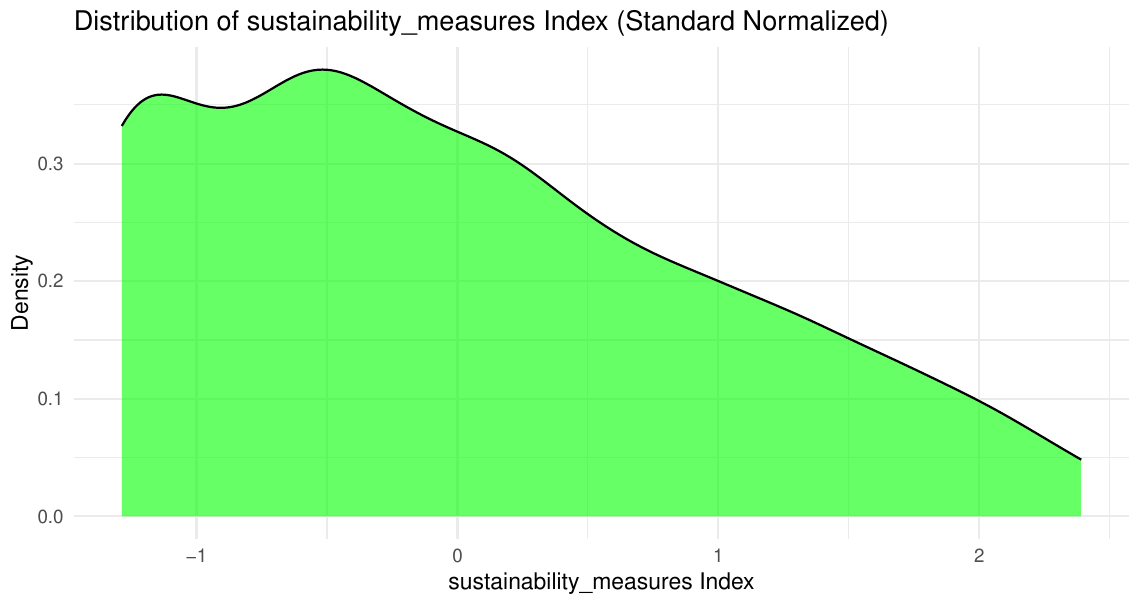
Regulatory pressures also play a critical role in driving GI adoption. Figure 5’s right-skewed density plot of GI adoption, influenced by external inspections (extInspection), corroborates Calel and Dechezleprêtre (2016), who found that regulatory mechanisms, such as environmental inspections, accelerate the diffusion of green technologies in carbon-intensive industries. In the Philippine context, inspections are particularly influential for manufacturing firms, which face stringent environmental regulations under the National Energy Efficiency and Conservation Plan (NEECP) (Department of Energy, Philippines 2023). The significant negative coefficients for managerial experience (MangYrExpSect, -0.0060 to -0.0073, p < 0.001) and firm age (nyearsOper, -0.0018 to -0.0025, p < 0.01) in Table 5, Table 6, and Table 7 suggest cultural and organizational barriers, such as resistance to change or entrenched operational practices, as noted by Shahin, Alimohammadlou, and Abbasi (2024) and D. Wang, Si, and Fahad (2023). These findings suggest that older firms and those with highly experienced managers exhibit lower efficiency scores despite GI adoption, potentially due to a lack of adaptability to modern green technologies.
The robustness of these findings is reinforced by sensitivity analyses, which show consistent GI impacts across different model specifications (7.27% in IV-Tobit, 3.44% in Efficiency2 models). These results align with Hottenrott, Rexhäuser, and Veugelers (2016), who emphasized the productivity benefits of green technology adoption, and Ghisetti and Rennings (2017), who found that environmental innovations enhance profitability in contexts with supportive regulatory frameworks. However, the negative effects of financial access (ChecAndORSavAccOwnshp, -0.1707 to -0.2519, p < 0.001) and digital infrastructure costs (InternetCost, -0.0173 to -0.0323, p < 0.05) highlight persistent challenges for SMEs, echoing Purwandani and Michaud (2021) and Indrawati et al. (2025), who identified financial and technological barriers as key impediments to green innovation in emerging economies. These findings underscore the need for targeted policy interventions, such as subsidies and training programs, to bridge the adoption gap for SMEs and enhance the overall impact of GI on firm efficiency in the Philippines.
6 Implications
This study’s findings, derived from the two-stage analysis of green technology innovation (GI) and firm-level technical efficiency using the Philippines 2024 World Bank Enterprise Survey (WBES) Green Economy dataset (N=748 firms), offer significant implications across theoretical, practical, policy, and sustainable development domains. The 7.3–8.7% efficiency gain from GI adoption, as measured by the GreenInov2 index, alongside the identification of firm size, regulatory pressures, and resource constraints as key moderators, provides a robust foundation for extending academic frameworks, guiding firm strategies, shaping policy interventions, and advancing global sustainability goals.
6.1 Theoretical Implications
This study extends the Resource-Based View (RBV) (Barney 1991; Hart 1995) and institutional theory (Miao and Popp 2014) by integrating green technology innovation (GI) into the analysis of firm-level technical efficiency in an emerging economy context. The positive and significant effect of GreenInov2 (0.0875, p < 0.001) on efficiency scores (Table 5) confirms that GI acts as a strategic resource, enhancing competitive advantage through improved resource utilization, as posited by RBV (Aragón-Correa and Sharma 2003). Unlike prior studies focusing on developed economies (Hottenrott, Rexhäuser, and Veugelers 2016; Ghisetti and Rennings 2017), this research highlights the applicability of RBV in the Philippines, where resource constraints, such as limited overdraft facility access (14.6%, Table 3), amplify the strategic importance of GI for efficiency gains, particularly among large firms (5.78–6.25% efficiency increase, Table 5, Table 6).
The study also advances institutional theory by demonstrating the role of external pressures, such as environmental inspections (extInspection), in driving GI adoption, as evidenced by the right-skewed density plot in Figure 5. This finding extends Calel and Dechezleprêtre (2016), who linked regulatory mechanisms to technological innovation, by showing that inspections are particularly influential in manufacturing sectors (44.4% of the sample) in emerging economies with evolving regulatory frameworks like the Philippines’ National Energy Efficiency and Conservation Plan (NEECP) (Department of Energy, Philippines 2023). The negative effects of managerial experience (MangYrExpSect, -0.0060 to -0.0073, p < 0.001) and firm age (nyearsOper, -0.0018 to -0.0025, p < 0.01) challenge traditional RBV assumptions about the universal benefits of intangible resources, suggesting that cultural and organizational inertia may hinder GI adoption, aligning with Shahin, Alimohammadlou, and Abbasi (2024) and D. Wang, Si, and Fahad (2023). This nuanced interaction between internal resources and external pressures enriches the theoretical understanding of how institutional and resource-based factors jointly shape green innovation outcomes in developing contexts.
Furthermore, the study contributes to the literature on efficiency measurement by validating the robustness of Data Envelopment Analysis (DEA) in capturing GI’s impact, as supported by Cooper (2013) and Simar and Wilson (2007). The consistency between raw and bootstrapped DEA scores (Table 4) and the use of a control function Tobit model to address endogeneity (Table 5) provide methodological advancements, particularly for handling right-censored efficiency data in heterogeneous samples. This approach extends Papke and Wooldridge (1996) and Wooldridge (2010) by applying fractional response models to green innovation studies, offering a blueprint for future research in emerging markets.
6.2 Practical Implications
Firms should prioritize strategic investments in green technologies, as the 7.3–8.7% efficiency gain from GreenInov2 adoption (Table 5) translates into tangible operational benefits, particularly for large firms and those in urban manufacturing hubs like Calabarzon (14.2% of the sample). The sector-wise efficiency differences (Figure 3) suggest that retail firms, with average efficiency scores near 0.8, should leverage consumer-driven demand for sustainability to further enhance GI adoption, as supported by D. Zhang, Rong, and Ji (2019). In contrast, manufacturing and hotel sectors (0.4–0.5 efficiency scores) should focus on energy-efficient technologies to address high electricity costs (mean: 3.87 million PHP, Table 3), which remain insignificant in regression models (p = 0.9035, Table 5), indicating GI’s potential to offset energy cost inefficiencies (International Energy Agency 2020; Song, Fisher, and Kwoh 2020).
The negative impact of managerial experience and firm age (Table 5, Table 6, Table 7) highlights the need for firms to address cultural barriers through targeted training programs. Older firms and those with highly experienced managers should foster a culture of adaptability, incorporating modern green practices to overcome resistance to change, as noted by Indrawati et al. (2025). For SMEs, which constitute 47.1% of the sample, the limited access to financial resources (e.g., 14.6% with overdraft facilities) underscores the importance of seeking alternative financing mechanisms, such as green loans or partnerships with larger firms, to fund GI initiatives (Leyva-de la Hiz, Ferron-Vilchez, and Aragon-Correa 2019; Purwandani and Michaud 2021). The significant website ownership (71.4%, Table 3) suggests that firms with digital infrastructure should leverage online platforms to promote their green initiatives, enhancing market competitiveness and aligning with consumer preferences for sustainable practices (Le et al. 2024).
6.3 Policy Implications
Targeted policies for SMEs are critical to bridge the GI adoption gap, given their lower efficiency scores (first quartile: 0.4086, Table 4) and financial constraints. The negative effect of checking/savings account ownership (ChecAndORSavAccOwnshp, -0.1707 to -0.2519, p < 0.001) and digital infrastructure costs (InternetCost, -0.0173 to -0.0323, p < 0.05) in regression models (Table 5, Table 6, Table 7) highlights the need for subsidies and low-interest loans to support SMEs in adopting costly green technologies, as recommended by De Groote and Verboven (2019) and Purwandani and Michaud (2021). The Philippine government could expand the NEECP framework (Department of Energy, Philippines 2023) to include tax incentives or grants for SMEs investing in energy-efficient technologies, particularly in water-intensive industries, where high water costs (WaterCost, mean: 1.07 million PHP) negatively impact efficiency (-0.0267 to -0.0392, p < 0.001).
Regulatory pressures, such as environmental inspections, should be strengthened, as their role in driving GI adoption is evident in the right-skewed density plot (Figure 5) and aligns with Calel and Dechezleprêtre (2016). Policies could prioritize frequent inspections for manufacturing firms, which dominate the sample (44.4%) and face high environmental compliance costs (mean PercSenManTimGovReg: 6.31%, Table 3). Additionally, capacity-building programs, such as workshops on green innovation, could address the negative efficiency effects of managerial experience and firm age by equipping older firms with the knowledge to integrate modern technologies, as suggested by D. Wang, Si, and Fahad (2023) and Huang and Huang (2024). Regional policies targeting urban hubs like Calabarzon, where GI adoption is higher, could serve as models for rural areas, promoting equitable access to green technology resources (Duque-Grisales and Aguilera-Caracuel 2021).
6.4 Sustainable Development Implications
GreenInov2 adoption supports Sustainable Development Goal (SDG) 9 (Industry, Innovation, and Infrastructure) by fostering innovation and resilient infrastructure through enhanced technical efficiency (7.3–8.7% gain, Table 5). The adoption of sustainability measures by 72.2% of firms, particularly in manufacturing and retail, contributes to building sustainable industrial systems, aligning with World Business Council for Sustainable Development (2018) and Tseng et al. (2013). This also generates spillovers to SDG 13 (Climate Action) through emissions reductions, as energy-efficient technologies mitigate the impact of high electricity costs (mean: 3.87 million PHP, Table 3), supporting the Philippines’ commitments under the Paris Agreement (World Bank Group 2024a). The weaker 5.9% revenue growth impact (Table 7) suggests that GI’s contribution to SDG 8 (Decent Work and Economic Growth) is more gradual, particularly for SMEs facing adoption costs, consistent with Ali et al. (2024) and Mohsin et al. (2022).
The study’s findings also have implications for SDG 12 (Responsible Consumption and Production), as GI adoption in retail and manufacturing promotes sustainable production practices, reducing resource waste (e.g., water and energy) and aligning with Ghadimi, Wang, and Lim (2019). For rural firms and SMEs, targeted policy interventions, such as those recommended above, could enhance access to green technologies, fostering inclusive growth (SDG 10: Reduced Inequalities) by narrowing the efficiency gap between large and small firms (Figure 4). By addressing cultural barriers through training, as evidenced by the negative effects of firm age and managerial experience, policies can further support SDG 4 (Quality Education), equipping firms with the skills needed for sustainable innovation (Indrawati et al. 2025). Collectively, these implications underscore the transformative potential of GI in advancing multiple SDGs in the Philippine context, with broader relevance for other emerging economies.
7 Conclusions and Future Research
This study investigates the impact of green technology innovation (GreenInov2) on firm-level technical efficiency in the Philippines, using the 2024 World Bank Enterprise Survey (WBES) Green Economy dataset (N=748 firms). By employing a two-stage analytical approach—Data Envelopment Analysis (DEA) to estimate efficiency scores and a control function Tobit model to assess GI’s impact—this research provides robust evidence of a 7.3–8.7% efficiency gain per standard deviation increase in GI adoption, with significant variations across firm size, sector, and region. Grounded in the Resource-Based View (RBV) (Barney 1991) and institutional theory (Miao and Popp 2014), the findings highlight the strategic and regulatory drivers of GI, while also revealing barriers such as financial constraints and cultural inertia among SMEs and older firms. This section synthesizes key findings, acknowledges limitations, proposes avenues for future research, and underscores the study’s broader impact on advancing green innovation in emerging economies.
7.1 Summary
The study’s core finding is that GreenInov2, adopted by 72.2% of firms through at least one of 10 sustainability measures, significantly enhances technical efficiency by 7.3–8.7% (Table 5), aligning with prior research in Asian manufacturing contexts (R. Li and Ramanathan 2018; Amornkitvikai, O’Brien, and Bhula-or 2024). Large firms exhibit a 5.78–6.25% efficiency advantage (Table 5, Table 6), supporting the hypothesis (H4) that firm size amplifies GI’s impact, as larger firms leverage economies of scale and greater resource endowments (Leyva-de la Hiz, Ferron-Vilchez, and Aragon-Correa 2019). Sectoral heterogeneity is evident, with retail firms achieving higher efficiency scores (near 0.8, Figure 3) compared to manufacturing and hotels (0.4–0.5), reflecting consumer-driven sustainability pressures (D. Zhang, Rong, and Ji 2019). Urban regions like Calabarzon (14.2% of the sample) show stronger GI adoption, consistent with infrastructure advantages (Duque-Grisales and Aguilera-Caracuel 2021).
Regulatory pressures, such as environmental inspections (extInspection), drive GI adoption, as visualized in Figure 5’s right-skewed distribution, corroborating institutional theory (Calel and Dechezleprêtre 2016). However, barriers such as limited financial access (only 14.6% of firms have overdraft facilities, Table 3) and high digital infrastructure costs (InternetCost, -0.0173 to -0.0323, p < 0.05, Table 5, Table 6) constrain SMEs, which constitute 47.1% of the sample. Unexpectedly, managerial experience (MangYrExpSect, -0.0060 to -0.0073, p < 0.001) and firm age (nyearsOper, -0.0018 to -0.0025, p < 0.01) negatively affect efficiency, suggesting cultural resistance to GI adoption (Shahin, Alimohammadlou, and Abbasi 2024; D. Wang, Si, and Fahad 2023). The weaker 5.9% revenue growth impact (Table 7) reflects market volatility post-COVID, consistent with Ali et al. (2024).
This study makes several contributions. Theoretically, it extends RBV and institutional theory by demonstrating GI’s role as a strategic resource and the influence of regulatory pressures in an emerging economy, enriching the literature on green innovation (Aragón-Correa and Sharma 2003; Miao and Popp 2014). Methodologically, the use of DEA with bootstrapping and a control function Tobit model to address endogeneity (Table 5) advances efficiency analysis, building on Simar and Wilson (2007) and Papke and Wooldridge (1996). Practically, the findings guide firms toward strategic GI investments, particularly in retail and urban manufacturing, while highlighting the need for SME-focused policies to overcome financial and cultural barriers (Purwandani and Michaud 2021; Indrawati et al. 2025). For sustainable development, the study supports SDGs 9, 13, 12, and 8 by linking GI to innovation, emissions reductions, responsible production, and economic growth (World Business Council for Sustainable Development 2018; Tseng et al. 2013).
7.2 Limitations
The reliance on cross-sectional WBES data limits dynamic insights into GreenInov2 adoption and efficiency gains. While the 2024 dataset provides a comprehensive snapshot (N=748), it cannot capture temporal changes in GI implementation or long-term efficiency trends, potentially underestimating the cumulative benefits of sustained adoption (Hottenrott, Rexhäuser, and Veugelers 2016). The self-reported nature of WBES data introduces risks of response bias, particularly for variables like PercSenManTimGovReg (mean: 6.31%, Table 3), where firms may underreport regulatory compliance time (World Bank Group 2024c). Additionally, the study’s focus on the Philippines restricts generalizability to other emerging economies with different regulatory or economic contexts, such as those with more developed financial systems (Ashraf et al. 2020).
The DEA methodology, while robust, assumes input-output relationships are stable, which may not fully account for external shocks (e.g., post-COVID supply chain disruptions) affecting efficiency scores (Coelli et al. 2005). The control function Tobit model addresses endogeneity but relies on instruments (writnObjectives, extInspection, log(Sales3)) that, while valid, may not capture all sources of unobserved heterogeneity (Wooldridge 2010). Finally, the study’s binary measures (e.g., web, ChecAndORSavAccOwnshp) oversimplify complex constructs like digital adoption or financial access, potentially masking nuanced effects (Le et al. 2024).
7.3 Future Research
Future studies should use longitudinal data to examine the dynamic effects of GreenInov2 adoption on efficiency and revenue growth, capturing how GI benefits evolve over time, particularly in post-COVID recovery contexts (Ali et al. 2024). Panel data could reveal whether the negative effects of managerial experience and firm age diminish as firms adapt to green technologies, addressing cultural barriers identified in this study (Shahin, Alimohammadlou, and Abbasi 2024).
The linear relationship assumed between GreenInov2 and efficiency may oversimplify GI’s impact. Future research should explore nonlinear effects, such as diminishing returns at high adoption levels or threshold effects where GI benefits emerge only after significant investment, using techniques like polynomial regression or machine learning (Veiga 2025; Saltelli et al. 2008). This could clarify why some firms, particularly SMEs, exhibit lower efficiency despite GI adoption.
Further investigation into regional and sectoral heterogeneity is warranted. While this study highlights Calabarzon’s advantages (14.2% of firms), rural regions and non-manufacturing sectors (e.g., services) remain underexplored. Comparative studies across Philippine regions or ASEAN countries could identify context-specific drivers of GI adoption, building on Khan et al. (2021) and Indrawati et al. (2025). Sectoral analyses could also examine why retail outperforms manufacturing, potentially due to consumer pressures or supply chain dynamics (D. Zhang, Rong, and Ji 2019; Ghadimi, Wang, and Lim 2019).
To address data quality concerns, future research should incorporate third-party-verified data, such as energy consumption records or regulatory compliance reports, to reduce self-reporting bias (World Bank Group 2024c). Integrating qualitative methods, such as interviews with managers, could provide deeper insights into cultural barriers linked to managerial experience and firm age, complementing quantitative findings (Huang and Huang 2024).
Cross-country comparisons would enhance generalizability. Comparing the Philippines with other emerging economies (e.g., Indonesia, Thailand) or developed economies with mature GI ecosystems (e.g., Germany) could reveal how institutional frameworks, financial access, and technological infrastructure shape GI outcomes (Ashraf et al. 2020; Popp 2011). Such studies could leverage multi-country WBES datasets to test the robustness of this study’s findings across diverse economic contexts.
7.4 Closing Remarks
This study underscores the transformative potential of green technology innovation in enhancing firm-level technical efficiency in the Philippines, offering a compelling case for integrating GI into strategic and policy frameworks. By demonstrating a 7.3–8.7% efficiency gain and identifying key moderators like firm size, regulatory pressures, and financial constraints, the research provides actionable insights for firms, policymakers, and sustainability advocates. Its contributions to RBV, institutional theory, and efficiency measurement advance academic discourse, while its practical and policy recommendations pave the way for inclusive GI adoption, particularly for SMEs. Aligned with SDGs 9, 13, 12, and 8, the findings highlight GI’s role in fostering sustainable industrial systems, reducing emissions, and promoting economic resilience in emerging economies. As the Philippines navigates its green transition, this study serves as a foundation for future research and policy action to maximize the benefits of green innovation, ensuring a sustainable and equitable future.
8 References
Adanma, Uwaga Monica, and Emmanuel Olurotimi Ogunbiyi. 2024. “Assessing the Economic and Environmental Impacts of Renewable Energy Adoption Across Different Global Regions.” Engineering Science & Technology Journal 5 (5): 1767–93.
Ali, Asif, Jinkai Li, Jin Zhang, and Muhammad Zubair Chishti. 2024. “Exploring the Impact of Green Finance and Technological Innovation on Green Economic Growth: Evidence from Emerging Market Economies.” Sustainable Development 32 (6): 6392–6407.
Ambec, Stefan, and Philippe Barla. 2006. “Can Environmental Regulations Be Good for Business? An Assessment of the Porter Hypothesis.” Energy Studies Review 14 (2).
Amornkitvikai, Yot, Martin O’Brien, and Ruttiya Bhula-or. 2024. “Toward Green Production Practices: Empirical Evidence from Thai Manufacturers’ Technical Efficiency.” Journal of Asian Business and Economic Studies 31 (3): 216–32.
Aragón-Correa, J. Alberto, and Sanjay Sharma. 2003. “A Contingent Resource-Based View of Proactive Corporate Environmental Strategy.” Academy of Management Review 28 (1): 71–88.
Asadi, S., S. OmSalameh Pourhashemi, M. Nilashi, R. Abdullah, S. Samad, E. Yadegaridehkordi, N. Aljojo, and N. S. Razali. 2020. “Investigating Influence of Green Innovation on Sustainability Performance: A Case on Malaysian Hotel Industry.” Journal of Cleaner Production 258: 120860. https://doi.org/10.1016/j.jclepro.2020.120860.
Ashraf, N., B. Comyns, S. Tariq, and H. R. Chaudhry. 2020. “Carbon Performance of Firms in Developing Countries: The Role of Financial Slack, Carbon Prices and Dense Network.” Journal of Cleaner Production 253: 119846. https://doi.org/10.1016/j.jclepro.2019.119846.
Baah, Charles, and Zhihong Jin. 2019. “Sustainable Supply Chain Management and Organizational Performance: The Intermediary Role of Competitive Advantage.” Journal of Managment & Sustainability 9: 119.
Bai, Rui, and Boqiang Lin. 2024. “An in-Depth Analysis of Green Innovation Efficiency: New Evidence Based on Club Convergence and Spatial Correlation Network.” Energy Economics 132: 107424.
Banker, Rajiv D., Abraham Charnes, and William W. Cooper. 1984. “Some Models for Estimating Technical and Scale Inefficiencies in Data Envelopment Analysis.” Management Science 30 (9): 1078–92. https://doi.org/10.1287/mnsc.30.9.1078.
Barney, Jay. 1991. “Firm Resources and Sustained Competitive Advantage.” Journal of Management 17 (1): 99–120. https://doi.org/10.1177/014920639101700108.
Behera, Puspanjali, Anasuya Haldar, and Narayan Sethi. 2023. “Achieving Carbon Neutrality Target in the Emerging Economies: Role of Renewable Energy and Green Technology.” Gondwana Research 121: 16–32.
Calel, Raphael, and Antoine Dechezleprêtre. 2016. “Environmental Policy and Directed Technological Change: Evidence from the European Carbon Market.” Review of Economics and Statistics 98 (1): 173–91.
Chen, W., X. Wang, N. Peng, X. Wei, and C. Lin. 2020. “Evaluation of the Green Innovation Efficiency of Chinese Industrial Enterprises: Research Based on the Three-Stage Chain Network SBM Model.” Mathematical Problems in Engineering 2020 (1): 3143651.
Coelli, Timothy J., D. S. Prasada Rao, Christopher J. O’Donnell, and George E. Battese. 2005. An Introduction to Efficiency and Productivity Analysis. Springer Science & Business Media. https://doi.org/10.1007/0-387-25895-7.
Cooper, William W. 2013. “Data Envelopment Analysis.” In Encyclopedia of Operations Research and Management Science, 349–58. Springer.
De Groote, Olivier, and Frank Verboven. 2019. “Subsidies and Time Discounting in New Technology Adoption: Evidence from Solar Photovoltaic Systems.” American Economic Review 109 (6): 2137–72. https://doi.org/10.1257/aer.20170409.
De Robles, Coleen Joyce, Jose Rafael De Leon, and Carlos Manapat. 2021. “Economic Growth at the Expense of Environmental Degradation: Evidence from the Philippines.” Journal of Economics, Finance and Accounting Studies 3 (2): 269–87.
Department of Energy, Philippines. 2023. “National Energy Efficiency and Conservation Plan (NEECP) Roadmap 2023–2050.” https://www.doe.gov.ph/neecp.
Dhillon, MK, Piyya Muhammad Rafi-ul-Shan, Hassan Amar, F Sher, and S Ahmed. 2023. “Flexible Green Supply Chain Management in Emerging Economies: A Systematic Literature Review.” Global Journal of Flexible Systems Management 24 (1): 1–28.
Duque-Grisales, Eduardo, and Javier Aguilera-Caracuel. 2021. “Environmental, Social and Governance (ESG) Scores and Financial Performance of Multilatinas: Moderating Effects of Geographic International Diversification and Financial Slack.” Journal of Business Ethics 168 (2): 315–34.
El-Kassar, Abdul-Nasser, and Sanjay Kumar Singh. 2019. “Green Innovation and Organizational Performance: The Influence of Big Data and the Moderating Role of Management Commitment.” Journal of Business Research 97: 77–87. https://doi.org/10.1016/j.jbusres.2018.12.030.
Endrikat, Jan, Edeltraud Guenther, and Holger Hoppe. 2014. “Making Sense of Conflicting Empirical Findings: A Meta-Analytic Review of the Relationship Between Corporate Environmental and Financial Performance.” European Management Journal 32 (5): 735–51. https://doi.org/10.1016/j.emj.2013.12.004.
Fahmy-Abdullah, Mohd, Lai Wei Sieng, and Hamdan Muhammad Isa. 2021. “Technical Efficiency in Malaysian Manufacturing Firms: A Stochastic Frontier Analysis Approach.” Journal of Sustainability Science and Management 16 (6): 243–55.
Farrell, Michael J. 1957. “The Measurement of Productive Efficiency.” Journal of the Royal Statistical Society: Series A (General) 120 (3): 253–81. https://doi.org/10.2307/2343100.
Ghadimi, Pezhman, Chao Wang, and Ming K. Lim. 2019. “Sustainable Supply Chain Modeling and Analysis: Past Debate, Present Problems and Future Challenges.” Resources, Conservation and Recycling 140: 72–84. https://doi.org/10.1016/j.resconrec.2018.09.005.
Ghisetti, Claudia, and Klaus Rennings. 2017. “Environmental Innovations and Profitability: How Does It Pay to Be Green?” Journal of Cleaner Production 142: 2948–59. https://doi.org/10.1016/j.jclepro.2016.10.165.
Giraudet, Louis-Gaëtan. 2020. “Energy Efficiency as a Credence Good: A Review of Informational Barriers to Energy Savings in the Building Sector.” Energy Economics 87: 104698.
Guillen, Maria D, Juan Aparicio, and Victor J España. 2023. “boostingDEA: A Boosting Approach to Data Envelopment Analysis in r.” SoftwareX 24: 101549.
Hart, Stuart L. 1995. “A Natural-Resource-Based View of the Firm.” Academy of Management Review 20 (4): 986–1014. https://doi.org/10.5465/amr.1995.9512280033.
Hottenrott, Hanna, Sascha Rexhäuser, and Reinhilde Veugelers. 2016. “Organisational Change and the Productivity Effects of Green Technology Adoption.” Resource and Energy Economics 43: 172–94. https://doi.org/10.1016/j.reseneeco.2016.01.001.
Huang, Yi-Chun, and Chih-Hsuan Huang. 2024. “Exploring Institutional Pressure, the Top Management Team’s Response, Green Innovation Adoption, and Firm Performance: Evidence from Taiwan’s Electrical and Electronics Industry.” European Journal of Innovation Management 27 (3): 800–824.
Indrawati, Henny, Caska Caska, Neni Hermita, Sumarno Sumarno, and Almasdi Syahza. 2025. “Green Innovation Adoption of SMEs in Indonesia: What Factors Determine It?” International Journal of Innovation Science 17 (1): 19–37.
International Energy Agency. 2020. “Energy Efficiency 2020.” https://www.iea.org/reports/energy-efficiency-2020.
Khan, Dilawar, Muhammad Nouman, József Popp, Muhammad Asif Khan, Faheem Ur Rehman, and Judit Oláh. 2021. “Link Between Technically Derived Energy Efficiency and Ecological Footprint: Empirical Evidence from the ASEAN Region.” Energies 14 (13): 3923.
Kumar, Ravinder, Gautam Dutta, and Rakesh Kumar Phanden. 2025. “Digitalization Adoption Barriers in the Context of Sustainability and Operational Excellence: Implications for SMEs.” Engineering Management Journal, 1–17.
Kuosmanen, Timo, Andrew Johnson, and Antti Saastamoinen. 2015. “Stochastic Nonparametric Approach to Efficiency Analysis: A Unified Framework.” In Data Envelopment Analysis: A Handbook of Models and Methods, 191–244. Springer.
Larbi-Siaw, Otu, Hu Xuhua, Ebenezer Owusu, Abigail Owusu-Agyeman, Brou Ettien Fulgence, and Samuel Akwasi Frimpong. 2022. “Eco-Innovation, Sustainable Business Performance and Market Turbulence Moderation in Emerging Economies.” Technology in Society 68: 101899.
Le, Thanh Tiep, Quynh Phan Vo Nhu, Thy Bui Ngoc Bao, Linh Vu Nguyen Thao, and Vijay Pereira. 2024. “Digitalisation Driving Sustainable Corporate Performance: The Mediation of Green Innovation and Green Supply Chain Management.” Journal of Cleaner Production 446: 141290.
Lee, Chien-Chiang, and Huwei Wen. 2025. “Global Value Chain Embedding and Enterprise Energy Efficiency: A Worldwide Firm-Level Analysis.” Renewable and Sustainable Energy Reviews 207: 114955.
Lee, Ki-Hoon, and Byung Min. 2015. “Green r&d for Eco-Innovation and Its Impact on Carbon Emissions and Firm Performance.” Journal of Cleaner Production 108: 534–42.
Leyva-de la Hiz, Dante I., Vera Ferron-Vilchez, and J. Alberto Aragon-Correa. 2019. “Do Firms’ Slack Resources Influence the Relationship Between Environmental Innovation and Financial Performance?” Journal of Business Research 104: 243–52. https://doi.org/10.1016/j.jbusres.2019.07.008.
Li, Guo, Ming K. Lim, and Zhaohua Wang. 2020. “Stakeholders, Green Manufacturing, and Practice Performance: Empirical Evidence from Chinese Fashion Businesses.” Annals of Operations Research 290 (1): 961–82. https://doi.org/10.1007/s10479-018-3070-6.
Li, R., and R. Ramanathan. 2018. “Exploring the Relationships Between Different Types of Environmental Regulations and Environmental Performance: Evidence from China.” Journal of Cleaner Production 196: 1329–40. https://doi.org/10.1016/j.jclepro.2018.06.132.
Lin, Boqiang, and Yongjing Xie. 2024. “Impact Assessment of Digital Transformation on the Green Innovation Efficiency of China’s Manufacturing Enterprises.” Environmental Impact Assessment Review 105: 107373.
Lin, Jiabao, Yanyun Zeng, Shaowu Wu, and Xin Robert Luo. 2024. “How Does Artificial Intelligence Affect the Environmental Performance of Organizations? The Role of Green Innovation and Green Culture.” Information & Management 61 (2): 103924.
Lin, T. X., Z. H. Wu, and J. J. Yang. 2023. “The Evaluation of Innovation Efficiency of China’s High-Tech Manufacturing Industry Based on the Analysis of the Three-Stage Network DEA-Malmquist Model.” Production Planning & Control, 1–13.
Liu, Lei, Li Zhang, and Wei Xu. 2024. “Analysis of Green Technology Innovation Efficiency Measurement in China’s High-Tech Industries.” Polish Journal of Environmental Studies 33 (1).
Liu, Shu, Ramayah Thurasamy, and Sri Rahayu Hijrah Hati. 2024. “Determinants and Outcomes of Green Technology Innovation Adoption Among Third-Party Logistics Firms in China: A SEM-ANN Analysis.” Systems 12 (9): 331.
Ma, Mengjuan, Xiao Zhu, Meishan Liu, and Xiaodong Huang. 2023. “Combining the Role of Green Finance and Environmental Sustainability on Green Economic Growth: Evidence from g-20 Economies.” Renewable Energy 207: 128–36.
Miao, Qing, and David Popp. 2014. “Necessity as the Mother of Invention: Innovative Responses to Natural Disasters.” Journal of Environmental Economics and Management 68 (2): 280–95.
Mohsin, Muhammad, Farhad Taghizadeh-Hesary, Nadeem Iqbal, and Hayot Berk Saydaliev. 2022. “The Role of Technological Progress and Renewable Energy Deployment in Green Economic Growth.” Renewable Energy 190: 777–87.
Moshood, T. D., G. Nawanir, F. Mahmud, F. Mohamad, M. H. Ahmad, A. AbdulGhani, and S. Kumar. 2022. “Green Product Innovation: A Means Towards Achieving Global Sustainable Product Within Biodegradable Plastic Industry.” Journal of Cleaner Production 363: 132506. https://doi.org/10.1016/j.jclepro.2022.132506.
Nie, Libing, Hong Gong, Danxiao Zhao, Xiuping Lai, and Mengyue Chang. 2022. “Heterogeneous Knowledge Spillover Channels in Universities and Green Technology Innovation in Local Firms: Stimulating Quantity or Quality?” Frontiers in Psychology 13: 943655.
Papke, Leslie E., and Jeffrey M. Wooldridge. 1996. “Econometric Methods for Fractional Response Variables with an Application to 401(k) Plan Participation Rates.” Journal of Applied Econometrics 11 (6): 619–32. https://doi.org/10.1002/(SICI)1099-1255(199611)11:6<619::AID-JAE417>3.0.CO;2-1.
Pei, Yu, Yingming Zhu, Suxia Liu, Xuechen Wang, and Jiajun Cao. 2019. “Environmental Regulation and Carbon Emission: The Mediation Effect of Technical Efficiency.” Journal of Cleaner Production 236: 117599.
Popp, David. 2011. “International Technology Transfer, Climate Change, and the Clean Development Mechanism.” Review of Environmental Economics and Policy 5 (1): 131–52. https://doi.org/10.1093/reep/req018.
Purwandani, Junia A, and Gilbert Michaud. 2021. “What Are the Drivers and Barriers for Green Business Practice Adoption for SMEs?” Environment Systems and Decisions 41 (4): 577–93.
Qing, Lingli, Jawad Abbas, Hina Najam, Xiang Ma, and Abd Alwahed Dagestani. 2024. “Investment in Renewable Energy and Green Financing and Their Role in Achieving Carbon-Neutrality and Economic Sustainability: Insights from Asian Region.” Renewable Energy 221: 119830.
Quarshie, Anne M, Asta Salmi, and Rudolf Leuschner. 2016. “Sustainability and Corporate Social Responsibility in Supply Chains: The State of Research in Supply Chain Management and Business Ethics Journals.” Journal of Purchasing and Supply Management 22 (2): 82–97.
Saltelli, Andrea, Marco Ratto, Terry Andres, Francesca Campolongo, Jessica Cariboni, Debora Gatelli, Michaela Saisana, and Stefano Tarantola. 2008. “Global Sensitivity Analysis: The Primer.” John Wiley & Sons. https://doi.org/10.1002/9780470725184.
Shahin, Vahideh, Moslem Alimohammadlou, and Abbas Abbasi. 2024. “Identifying and Prioritizing the Barriers to Green Innovation in SMEs and the Strategies to Counteract the Barriers: An Interval-Valued Intuitionistic Fuzzy Approach.” Technological Forecasting and Social Change 204: 123408.
Shahzad, Mohsin, Ying Qu, Saif Ur Rehman, and Abaid Ullah Zafar. 2022. “Adoption of Green Innovation Technology to Accelerate Sustainable Development Among Manufacturing Industry.” Journal of Innovation & Knowledge 7 (4): 100231.
Sharif, Arshian, Sinem Kocak, Hafizah Hammad Ahmad Khan, Gizem Uzuner, and Sunil Tiwari. 2023. “Demystifying the Links Between Green Technology Innovation, Economic Growth, and Environmental Tax in ASEAN-6 Countries: The Dynamic Role of Green Energy and Green Investment.” Gondwana Research 115: 98–106.
Simar, Léopold, and Paul W. Wilson. 2007. “Estimation and Inference in Two-Stage, Semi-Parametric Models of Production Processes.” Journal of Econometrics 136 (1): 31–64. https://doi.org/10.1016/j.jeconom.2005.07.009.
Song, Malin, Ron Fisher, and Yusen Kwoh. 2020. “Energy Efficiency, Renewable Energy, and Economic Performance: Evidence from Chinese Firms.” Journal of Cleaner Production 270: 122516. https://doi.org/10.1016/j.jclepro.2020.122516.
Tseng, M.-L., A. S. F. Chiu, R. R. Tan, and A. B. Siriban-Manalang. 2013. “Sustainable Consumption and Production for Asia: Sustainability Through Green Design and Practice.” Journal of Cleaner Production 40: 1–5. https://doi.org/10.1016/j.jclepro.2012.07.015.
United Nations Department of Economic and Social Affairs. 2008. “International Standard Industrial Classification of All Economic Activities (ISIC), Revision 4.” https://unstats.un.org/unsd/classifications/Econ/isic.
Ushie, A. M., X. Jiang, A. Ali, A. C. Nwoba, and S. F. A. Hossain. 2023. “Green Innovation in Emerging Economies: The Role of Managerial Ties and Market Learning.” Business Strategy and the Environment 32 (6): 3513–28.
Veiga, P. M. 2025. “Key Drivers of Green Innovation in Family Firms: A Machine Learning Approach.” Journal of Family Business Management 15 (2): 346–72.
Wang, Dan, Ruishi Si, and Shah Fahad. 2023. “Evaluating the Small and Medium Sized Enterprises Motivating Factors and Influencing Barriers about Adoption of Green Practices.” Environment, Development and Sustainability 25 (4): 3029–41.
Wang, Zongrun, Taiyu Zhang, Xiaohang Ren, and Yukun Shi. 2024. “AI Adoption Rate and Corporate Green Innovation Efficiency: Evidence from Chinese Energy Companies.” Energy Economics 132: 107499.
Wen, Jun, Waheed Ali, Jamal Hussain, Nadeem Akhtar Khan, Hadi Hussain, Najabat Ali, and Rizwan Akhtar. 2022. “Dynamics Between Green Innovation and Environmental Quality: New Insights into South Asian Economies.” Economia Politica 39 (2): 543–65.
Wooldridge, Jeffrey M. 2010. Econometric Analysis of Cross Section and Panel Data. 2nd ed. Cambridge, MA: MIT Press.
World Bank Group. 2024a. “Philippines 2024 World Bank Enterprise Survey Green Economy.” https://www.enterprisesurveys.org.
———. 2024b. “Philippines 2024 World Bank Enterprise Survey Green Economy Implementation Report.” https://www.enterprisesurveys.org/en/survey-documents.
———. 2024c. “World Bank Enterprise Surveys: Methodology.” https://www.enterprisesurveys.org/en/methodology.
World Business Council for Sustainable Development. 2018. “Sustainability Reporting and the SDGs.” https://www.wbcsd.org/Programs/Redefining-Value/External-Disclosure/Sustainability-reporting-and-the-SDGs.
World Intellectual Property Organization. 2022. “Green Technology Book: Solutions for Climate Change Adaptation.” https://www.wipo.int/green-technology-book-adaptation/en/.
Yang, Siying, Wenzhi Wang, Dawei Feng, and Jingjing Lu. 2022. “Impact of Pilot Environmental Policy on Urban Eco-Innovation.” Journal of Cleaner Production 341: 130858.
Zhang, D., Z. Rong, and Q. Ji. 2019. “Green Innovation and Firm Performance: Evidence from Listed Companies in China.” Resources, Conservation and Recycling 144: 48–55. https://doi.org/10.1016/j.resconrec.2019.01.023.
Zhang, Y., H. Chen, and Z. He. 2022. “Regional Green Innovation Efficiency and Dynamic Evolution of Chinese Industrial Enterprises: A Three-Stage Super-Efficiency DEA Method Based on Cooperative Game.” Environmental Science and Pollution Research 29 (59): 89387–410.
Zhao, Dan, Chenghui Tang, and Xiaolin Huang. 2025. “Innovation Network, Knowledge Spillover, and Urban Green Economic Performance.” Frontiers in Physics 13: 1537110.
Acknowledgments. The author would like to acknowledge Al Ain University’s Funding Support for Registration and Conference participation.