# R packages used for the bivariate Gaussian copula regression analysis
library(GJRM)      # Bivariate copula regression with GAMLSS margins
library(ggplot2)   # Data visualization
library(dplyr)     # Data manipulation
library(haven)     # Reading Stata/SPSS files (EHCVM data format)
library(survey)    # Survey-weighted analysis
library(maps) # Geographic visualizationDigital and Financial Inclusion in Burkina Faso: Impacts on Household Welfare and the Mediating Role of the COVID-19 Pandemic
Digitalization Inclusion and Development
Examines how mobile phone ownership, internet access, and bank account possession influence household food and non-food consumption expenditures in Burkina Faso using EHCVM panel data (2018 and 2021), employing a bivariate Gaussian copula regression model with log-normal margins to assess digital and financial inclusion effects and the mediating role of the COVID-19 pandemic.
Abstract
This study examines the impact of digital and financial inclusion (DFI) on household economic well-being in Burkina Faso, focusing on food (dali) and non-food (dnal) consumption expenditures, using panel data from the 2018 and 2021 waves of the Harmonized Survey on Household Living Standards (EHCVM). A bivariate Gaussian copula regression model with log-normal margins is employed to analyze how mobile phone ownership, internet access, and bank account possession drive consumption patterns, with the Covid-19 pandemic as a mediating factor. Findings indicate that DFI significantly increases mean food and non-food consumption by 6.77–18.29% and 10.26–14.72%, respectively, though pandemic-mediated effects show a 0.54–9.64% reduction for mobile phone and bank account impacts in 2021, while internet access boosts consumption by 7.07–12.62% post-pandemic (p < 0.001). Digital inclusion increases consumption variance (1.31–9.35%), while financial inclusion reduces food consumption variance by 5.33% but increases non-food variance by 2.07% (p < 0.001). The covariance between food and non-food spending (\theta = 0.564) is strengthened by digital inclusion but weakened by financial inclusion. Control factors, including household size, urban residency, and education, further shape outcomes. Theoretically, the study extends platform ecosystem theory by integrating DFI in African contexts, highlighting adaptive responses to economic shocks. Practically, it suggests firms leverage DFI for market access, while policy recommendations advocate for enhanced digital infrastructure and financial access to align with SDGs 1 (No Poverty), 9 (Industry, Innovation, and Infrastructure), and 10 (Reduced Inequalities).
Keywords: Digital Financial Inclusion, Household Welfare, Consumption Spending, Burkina Faso, Bivariate Copula
1. Introduction
The Fourth Industrial Revolution, characterized by rapid advancements in digital and financial technologies, is reshaping household economic well-being globally, with profound implications for socio-economic empowerment in developing regions like Burkina Faso (Shen et al., 2024). Digital and financial inclusion (DFI) has emerged as a critical driver of household welfare, facilitating investment diversification (Lu et al., 2023), agricultural participation (Mumtaz, 2024), mechanization (Ma et al., 2023), and economic growth (F. Liu & Walheer, 2022; Traoré & Abdou Khadre, 2025), while reducing poverty and consumption inequality (Luo & Li, 2022; Senou & Acclassato Houensou, 2024; Soro & Senou, 2023; Yan et al., 2024). In the West African Economic and Monetary Union (WAEMU), studies highlight DFI’s transformative potential through mobile money and FinTech, particularly in overcoming barriers such as cost, distance, and lack of trust (Ahamadou & Agada, 2023; Dianda, Thiombiano, & Nézan Okey, 2025; Dianda, Thiombiano, & Okey, 2025). These advancements are particularly vital in the Alliance of the Sahel States (AES), where Burkina Faso’s evolving digital landscape and financial inclusion efforts present a unique opportunity to enhance living standards amidst security, economic and environmental challenges.
Empirical evidence underscores DFI’s transformative potential. For instance, Ye et al. (2022), using data from the China Household Finance Survey (CHFS) and the Peking University DFI Index, found that digital finance significantly boosts household participation in risky financial markets by improving access to information and reducing wealth and cognitive barriers. Similarly, Luo & Li (2022), employing biennial CHFS data (2015–2017), reported that DFI reduces consumption inequality, with intensive usage having a stronger effect than extensive usage. In another study, Tian & Guo (2022), using China Family Panel Studies (CFPS) data, showed that DFI narrows income gaps, particularly in urban areas, through enhanced financial product holdings, credit availability, and financial literacy. Lin & Zhang (2023), applying extreme value theory to CFPS and PKU-DFIIC data (2014–2018), further confirmed that DFI reduces poverty and promotes consumption and financial asset holding, though with limited impact on consumption efficiency. In rural China, Jin et al. (2024), using 2019 CHFS data, demonstrated that financial inclusion—encompassing savings, digital payments, credit, and insurance—positively impacts household welfare through increased consumption expenditure, influenced by factors like family size, education, and financial literacy, findings echoed in WAEMU contexts where education drives financial inclusion (Compaoré et al., 2025; Koffi & Kouadio, 2024).
In non-Chinese contexts, Apeti (2023) analyzed data from 76 developing countries (1990–2019) and found that mobile money adoption reduces household consumption volatility, with financial inclusion and remittances amplifying this stabilizing effect, a pattern observed in WAEMU countries where mobile money accelerates poverty reduction (Coulibaly, 2021; Senou et al., 2019b; Senou & Acclassato Houensou, 2024). A systematic review by Shen et al. (2024) of 50 influential publications highlighted three key research streams on financial inclusion: financial services accessibility, capability, and literacy, with emerging trends in FinTech integration, sustainability, and impacts on poverty alleviation and inequality reduction. Additionally, Obiora & Ozili (2023) emphasized the benefits of digital-only financial inclusion strategies, including convenience, access to services, data generation, and improved social welfare, particularly in reaching remote areas and enhancing digital literacy. In WAEMU, studies confirm that electronic money and FinTech enhance financial inclusion by extending services to underserved populations, with significant implications for human development and gender equity (Dianda, Thiombiano, & Okey, 2025; Ndione et al., 2024; Ouedraogo & Thiombiano, 2025).
Despite these insights, a critical gap persists in understanding the combined effects of digital inclusion and financial inclusion on household food (dali) and non-food (dnal) wellness in AES countries like Burkina Faso, particularly under the mediating influence of the Covid-19 pandemic. In Burkina Faso, digital and financial access remains limited but growing: the Global Findex 2017 reported 43% account ownership, with 20% using mobile money accounts, while by 2021, Sub-Saharan Africa’s account ownership reached 55%, though with a 12% gender gap (F. Liu & Walheer, 2022; Shen et al., 2024). Mobile phone penetration is high (70–80%), but internet access lags at 15–30%, with stark rural-urban disparities (15% rural vs. 36% urban in 2018) and a widening gender gap by 2021 (20% men vs. 11% women) (Lai et al., 2020; Obiora & Ozili, 2023; Yan et al., 2024). Recent evidence from women-specific analyses post-COVID, using DHS-V data, further reveals that access to mobile and smart telecommunication services positively associates with mobile financial services usage, mediated by formal financial inclusion, with standard mobile phones yielding higher premiums than smartphones (Niankara et al., 2025). This underscores the need to address gender dynamics in DFI’s impact on household welfare.
The present study addresses this gap by investigating how mobile phone ownership, internet access, and bank account possession influence household consumption patterns in Burkina Faso, using data from the 2018 and 2021 waves of the Harmonized Survey on Household Living Standards (EHCVM) (Commission de l’UEMOA, 2023). It employs a bivariate Gaussian copula regression model with log-normal margins to quantify DFI’s impacts on consumption means, variances, and covariance, while assessing the pandemic’s mediating role. The research is guided by four objectives:
- To conduct a comprehensive and systematic review of the global literature on the welfare implications of digital and financial inclusion;
- To quantify the effects of digital and financial inclusion on household food and non-food consumption spending in Burkina Faso;
- To analyze the mediating role of the Covid-19 pandemic on these effects;
- To provide policy recommendations for closing digital and financial inclusion gaps to foster economic empowerment and align with UN Sustainable Development Goals (SDGs) 1 (No Poverty), 9 (Industry, Innovation, and Infrastructure), and 10 (Reduced Inequalities).
2. Literature Review
2.1 Scopus-Based Knowledge Source
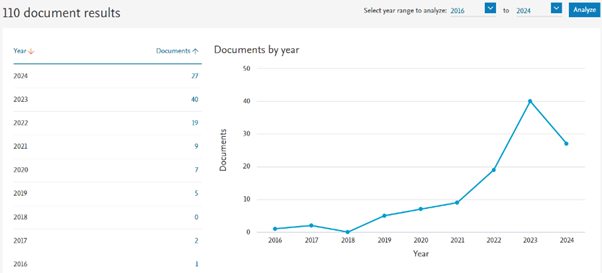
To objectively contextualize the current research, a full literature overview on household digital and financial inclusion and its welfare consequences is conducted using the PRISMA 2020 standard for systematic bibliographic data collection from Scopus. The relevant search strategy and refinement protocol are detailed in Table 1. The initial search conducted on June 24, 2024 used the terms “Household” AND “Digital” AND “Financial” AND “Inclusion” in the “TITLE-ABS-KEY” search tab within Scopus to yield 162 documents. Successive refinements based on subject area, document type, source type, and language restrictions led to the final selection of 110 English-published journal articles and reviews, as shown below.
Table 1: PRISMA Stages, Scopus Search String and Search Results
| PRISMA Stage | Scopus Search String | Results |
|---|---|---|
| 1–2. Initial Search & Selection | TITLE-ABS-KEY (household AND digital AND financial AND inclusion) | 162 |
| 3. Quality assessment & Subject area | + LIMIT-TO (SUBJAREA, “ECON” OR “SOCI” OR “BUSI”) | 132 |
| 4. Document type restrictions | + LIMIT-TO (DOCTYPE, “ar” OR “re”) | 114 |
| 5. Source type restrictions | + LIMIT-TO (SRCTYPE, “j”) | 114 |
| 6. Language type restrictions | + LIMIT-TO (LANGUAGE, “English”) | 110 |
| 7. Data extraction | CSV file of journal articles (2016–2024) | 110 |
As shown in Figure 1, the bibliographic data of these 110 documents were subsequently exported from Scopus as a single CSV file for further mapping and descriptive analytics using the R package Bibliometrix (Aria & Cuccurullo, 2017).
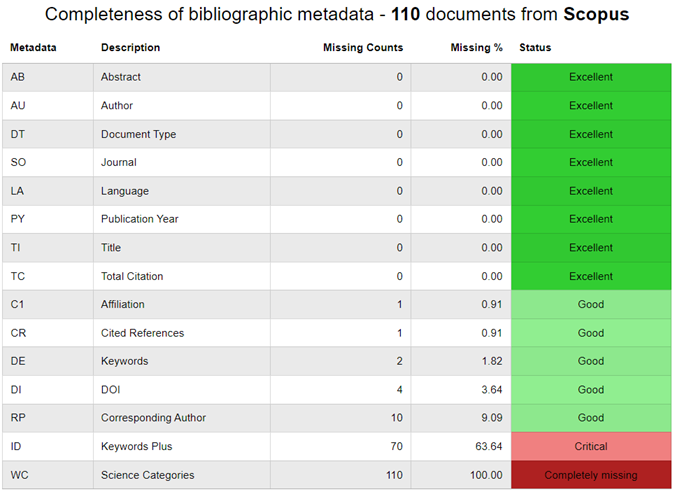
The initial data quality assessment within Bibliometrix, to evaluate the completeness of the bibliographic metadata, resulted in the highlighted status shown in Figure 2. Overall, except for “science categories” and “keywords plus” which are unused in the subsequent analysis, all metadata show excellent-to-good quality status.
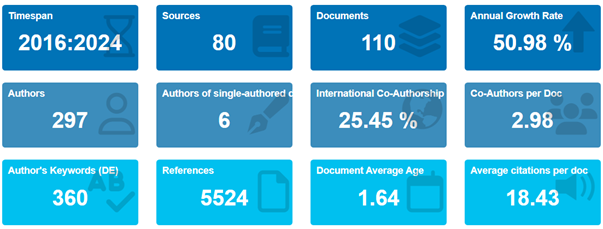
The descriptive features of the bibliographic data collection are summarized in Figure 3. Between January 2016 and June 24, 2024, about 80 sources/journals published 110 article and review papers on the welfare implications of digital and financial inclusions for households. Drawing from 5,524 references and 360 author-provided keywords, involving 297 authors with only 6 single-authored publications, these 110 documents average 1.64 years old, with 18.43 citations each. The international co-authorship rate of 25.45%, equating to about 2.98 co-authors per document, coupled with the 50.98% annual growth rate, suggest a recent yet rapidly growing interest in this research field.
The application of Bradford’s Law to the examined bibliographic data collection resulted in the core source distribution depicted in Figure 4. As illustrated, the core sources publishing on the welfare consequences for households of digital and financial inclusion include twelve scholarly journals: Finance Research Letters, Sustainability (Switzerland), Social Indicators Research, Accounting and Finance, Agricultural Finance Review, Sage Open, Telecommunications Policy, Applied Economics, Applied Economics Letters, China Agricultural Economic Review, China and World Economy, and Cogent Economics and Finance.
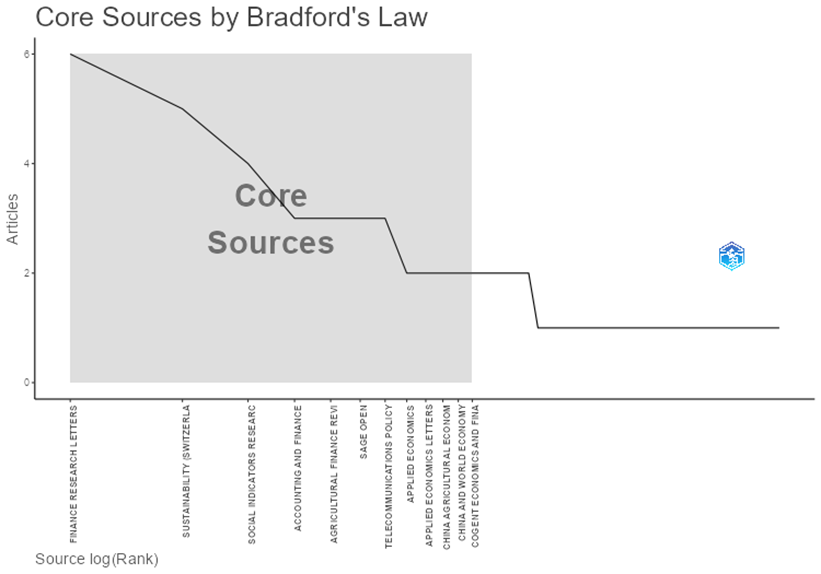
Figure 5 illustrates the top 10 most relevant authors in this knowledge domain along with their dynamic productivity and impact over time. Wang X. emerges as the most prolific author, having contributed three research articles between 2020 and 2023, followed by Hu D., Liu Y., and Zhang X., all of whom contributed three articles as of June 24, 2024.
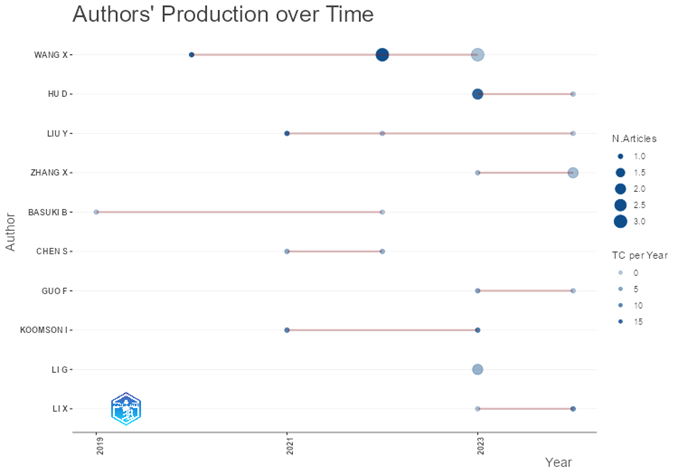
Figure 6 identifies the top 10 most relevant academic institutions. Topping the list is Renmin University of China with 16 publications, followed by Wuhan University with 10, then Guangdong University of Foreign Studies and University of Lome with 6 each.
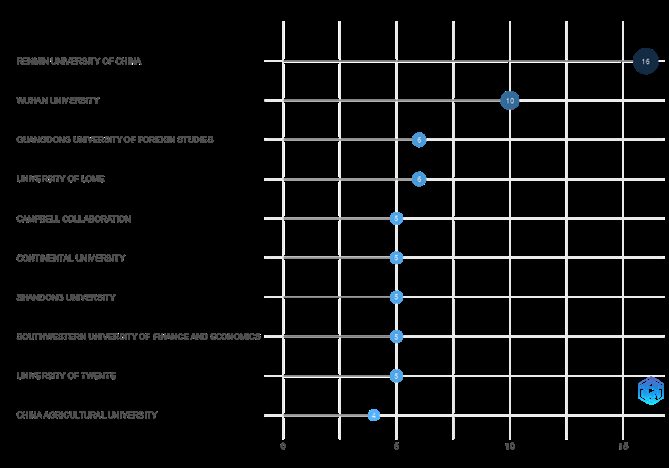
Figure 7 highlights the top 20 most relevant corresponding authors’ countries based on both single-country (SCP) and multiple-country (MCP) research contributions. China, the USA, India, the UK, and Australia appear respectively in the top 5.
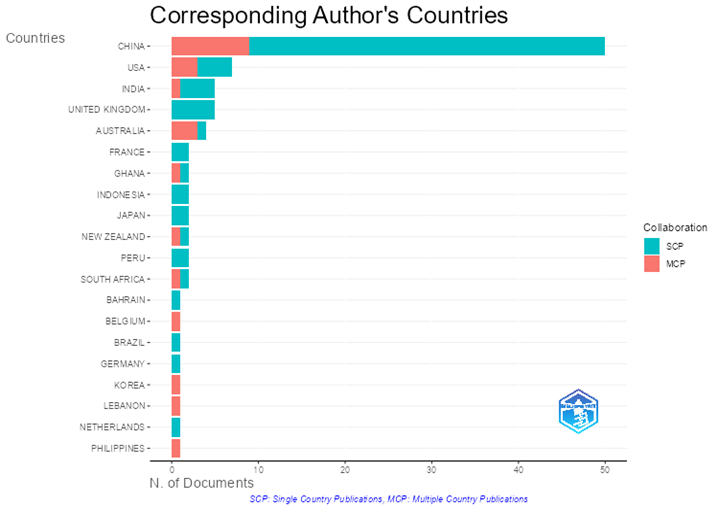
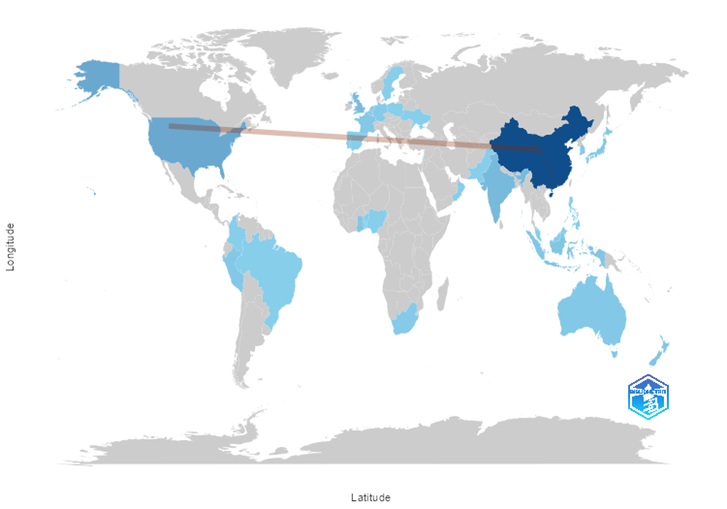
Figure 8 presents the country scientific productivity and international collaboration world-map, highlighting 5 collaborations between China and USA as the two most productive countries.
Delving into the content of produced research articles, the word cloud in Figure 9 and the tree map in Figure 10 reveal “financial inclusion” and “digital financial inclusion” as the top 2 most relevant author-provided keywords, with 16% (36) and 12% (26) relative frequency counts respectively.
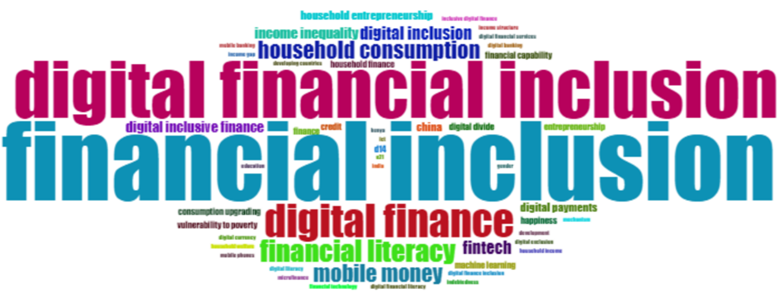
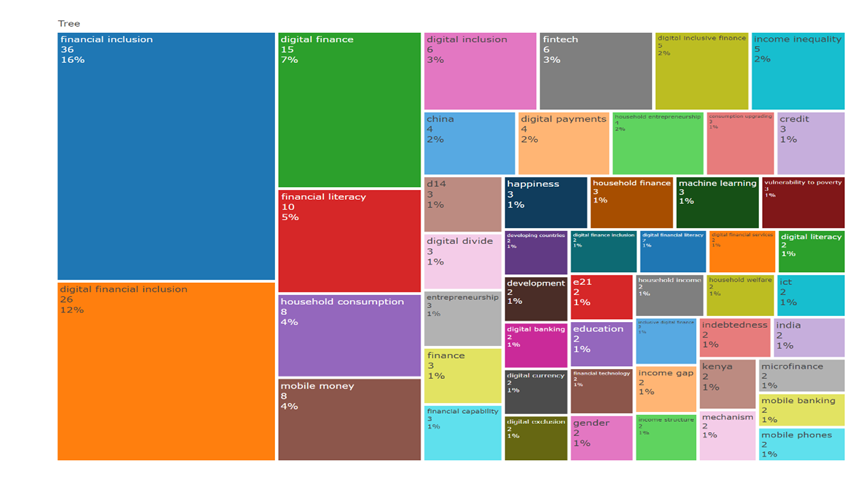
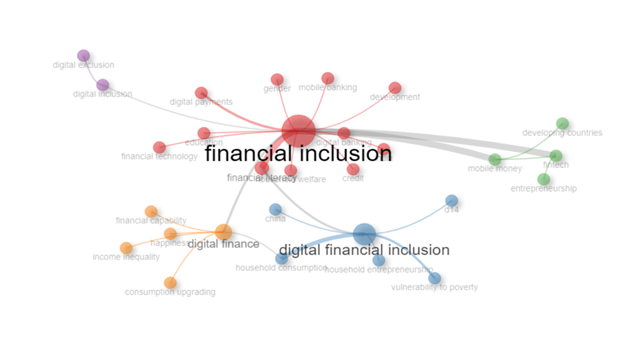
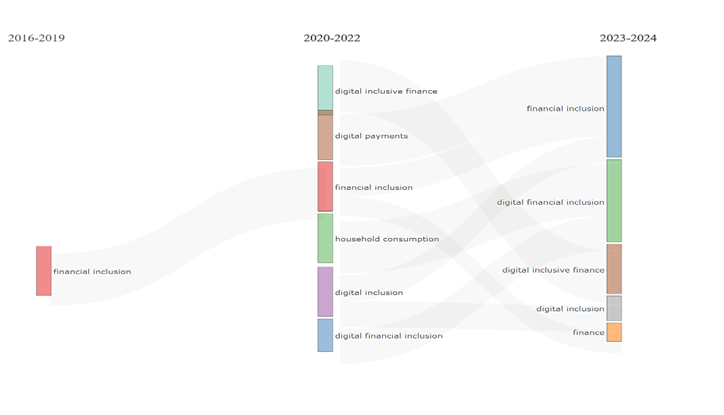
Figure 11 provides the co-word network map of the most relevant keywords, Figure 12 the static thematic map, and Figure 13 the dynamic thematic evolution between 2016 and 2024. The dynamic characterization shows that “financial inclusion” was the single most dominant topic in the pre-pandemic era (2016–2019). In the post-pandemic era (2020–2022), emerging dominant topics included “digital inclusive finance”, “digital payments”, “household consumption”, “digital inclusion”, and “digital financial inclusion”. These trends continued in 2023–2024.
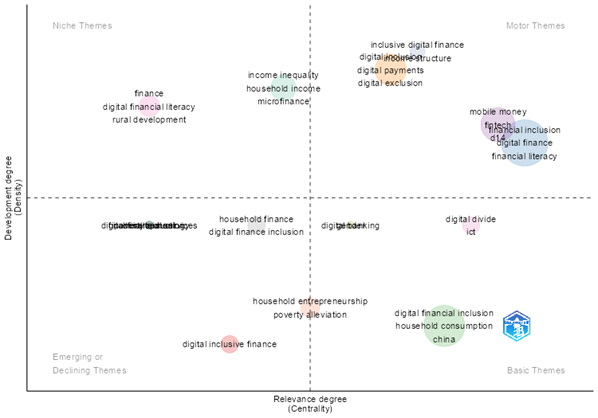
The static thematic map (Figure 12) shows in the bottom right quadrant the basic thematic cluster of “digital financial inclusion” and “household consumption” in “china”, located in the highly relevant but less developed knowledge space. The subsequent empirical analysis builds on this thematic cluster, contextualized to the West African economic and monetary union member states.
Table 2: Top 20 Most Locally Cited References in the Collection
| Cited Reference | Citations |
|---|---|
| Demirguc-Kunt et al. (2018) — Global Findex Database 2017 | 15 |
| Ozili P.K. (2018) — Impact of digital finance on financial inclusion, Borsa Istanbul Review | 11 |
| Li J., Wu Y., Xiao J.J. (2020) — Impact of digital finance on household consumption, Economic Modelling | 10 |
| Suri T., Jack W. (2016) — Long-run poverty and gender impacts of mobile money, Science | 9 |
| Munyegera G.K., Matsumoto T. (2016) — Mobile money, remittances, and household welfare, World Development | 7 |
| Guo F. et al. (2020) — Measuring China’s digital financial inclusion, China Economic Quarterly | 6 |
| He J., Li Q. (2020) — Online social interaction and digital finance participation, China Agricultural Economic Review | 5 |
| Li J., Wu Y., Xiao J.J. (2020) — Impact of digital finance, Economic Modelling (alt. entry) | 5 |
| Liu Y. et al. (2021) — Digital financial inclusion and economic growth, IRFA | 5 |
| Wooldridge J.M. (2010) — Econometric Analysis of Cross Section and Panel Data | 5 |
| Aterido R. et al. (2013) — Access to finance in Sub-Saharan Africa: gender gap?, World Development | 4 |
| Beck T. et al. (2007) — Finance, inequality and the poor, Journal of Economic Growth | 4 |
| Bruhn M., Love I. (2014) — Real impact of improved access to finance: Mexico, Journal of Finance | 4 |
| Chen L. (2016) — From FinTech to FinLife, China Economic Journal | 4 |
| Demir A. et al. (2022) — FinTech, financial inclusion and income inequality, European Journal of Finance | 4 |
| Demirguc-Kunt A., Klapper L. (2013) — Measuring financial inclusion, Brookings Papers | 4 |
| Fungacova Z., Weill L. (2015) — Understanding financial inclusion in China, China Economic Review | 4 |
| Ghosh S., Vinod D. (2017) — What constrains financial inclusion for women? World Development | 4 |
| Gomber P. et al. (2017) — Digital finance and FinTech, Journal of Business Economics | 4 |
| Hannig A., Jansen S. (2010) — Financial inclusion and financial stability | 4 |
Table 3: Top 20 Most Locally Cited Journal Articles and Reviews in the Collection
| Document | DOI | Year | Local Citations | Global Citations |
|---|---|---|---|---|
| Liu Y., China Agric. Econ. Rev. | 10.1108/CAER-06-2020-0141 | 2021 | 5 | 62 |
| Lai J.T., China World Econ. | 10.1111/cwe.12312 | 2020 | 5 | 61 |
| Gabor D., New Polit. Econ. | 10.1080/13563467.2017.1259298 | 2017 | 3 | 404 |
| Peng P., Soc. Indic. Res. | 10.1007/s11205-022-03019-z | 2023 | 2 | 13 |
| Wang X., China Agric. Econ. Rev. | 10.1108/CAER-08-2020-0189 | 2022 | 2 | 46 |
| Kusimba S., Econ. Anthropol. | 10.1002/sea2.12055 | 2016 | 2 | 29 |
| Liu F., Empir. Econ. | 10.1007/s00181-021-02178-1 | 2022 | 1 | 15 |
| Liu L., Soc. Indic. Res. | 10.1007/s11205-023-03245-z | 2023 | 1 | 5 |
| Johnen C., J. Int. Dev. | 10.1002/jid.3687 | 2023 | 1 | 7 |
| Wang X., China Econ. Q. Int. | 10.1016/j.ceqi.2022.11.006 | 2022 | 1 | 6 |
| Lu X., Account. Financ. | 10.1111/acfi.12863 | 2021 | 1 | 16 |
| Lu X., Account. Financ. | 10.1111/acfi.13043 | 2023 | 1 | 9 |
| Morgan P.J., Asian Econ. Policy Rev. | 10.1111/aepr.12379 | 2022 | 1 | 39 |
| Luo Y., Int. Rev. Econ. Financ. | 10.1016/j.iref.2021.05.010 | 2021 | 1 | 57 |
| Tiwari J., Dev. Pract. | 10.1080/09614524.2019.1654432 | 2019 | 1 | 16 |
| Hasbi M., Telecommun. Policy | 10.1016/j.telpol.2020.101944 | 2020 | 0 | 32 |
| Jungo J., Int. J. Soc. Econ. | 10.1108/IJSE-08-2022-0520 | 2023 | 0 | 3 |
| Cnaan R.A., J. Soc. Policy | 10.1017/S0047279421000738 | 2023 | 0 | 4 |
| Meng K., Inf. Technol. Dev. | 10.1080/02681102.2022.2097622 | 2023 | 0 | 13 |
| Tavera-Mesías J.F., Behav. Inf. Technol. | 10.1080/0144929X.2022.2054729 | 2023 | 0 | 5 |
2.2 Thematic Evaluation
The critical content evaluation of the most relevant subset of the literature reveals key stylized facts about the welfare consequences of digital and financial inclusion (DFI), with insights from both global and WAEMU contexts, including Burkina Faso. Globally, particularly in China, welfare consequences include household production (Y. Liu et al., 2021), consumption (Jiang et al., 2024; Lai et al., 2020), poverty reduction (Peng & Mao, 2023; Senou & Acclassato Houensou, 2024; Wang & Fu, 2022), income inequality reduction (L. Liu & Guo, 2023; Soro & Senou, 2023), financial substitution (Li & Sui, 2023), investment diversification (Lu et al., 2021), risk sharing (Wang & Wang, 2022), and insurance coverage (Hou et al., 2024). In the WAEMU region, studies emphasize DFI’s role in overcoming socioeconomic barriers (Compaoré et al., 2025; Dianda, Thiombiano, & Nézan Okey, 2025), promoting mobile money adoption (Coulibaly, 2021; Dianda, Thiombiano, & Okey, 2025; Senou et al., 2019b), reducing income inequality (Soro & Senou, 2023), and enhancing human development (Ouedraogo & Thiombiano, 2025).
Key findings from the literature include:
With regard to poverty reduction, Wang & Fu (2022) found that DFI significantly mitigates Chinese rural households’ vulnerability to poverty through agricultural productivity improvement, entrepreneurial activities stimulation, and non-agricultural employment promotion. Similarly, in WAEMU, Senou & Acclassato Houensou (2024) demonstrated that mobile money significantly reduces poverty by expanding financial services access, particularly for underserved populations in Burkina Faso and other WAEMU countries.
Regarding income inequality, L. Liu & Guo (2023) reported that DFI significantly alleviates household vulnerability to relative poverty by improving family health status, enhancing development-oriented consumption, and increasing family happiness. In the WAEMU context, Soro & Senou (2023) showed that digital financial inclusion significantly reduces income inequality, with heterogeneous effects across countries.
On financial substitution and investment, Li & Sui (2023) found that DFI enhances household financial substitution, shifting households toward financial investment. Lu et al. (2021) reported that DFI reduces the likelihood of extreme portfolio risks by encouraging investment diversification, with stronger effects among low-wealth and low-financial-literacy households.
Concerning consumption, Lai et al. (2020) found that DFI enables Chinese households to smooth approximately 70% of transitory income shocks. Jiang et al. (2024) reported that DFI enhances consumption levels in China by increasing financial asset holdings and financial literacy, with stronger effects in rural areas.
Complementing these findings, Niankara et al. (2025) examine the endogenous nexus between women’s access to mobile and smart telecommunication services (MSTSs) and their consumption of mobile financial services (MFS) in post-COVID-19 Burkina Faso, emphasizing the mediating role of formal financial inclusion. Utilizing 2021 DHS-V survey data from 17,659 women aged 15–49, they apply spatial semiparametric trivariate copula regression to address endogeneity, revealing positive associations between MSTS access and MFS usage, with standard mobile phones unexpectedly yielding higher consumption premiums than smartphones.
While global studies provide robust evidence on DFI’s welfare impacts, the WAEMU literature lacks specific focus on Burkina Faso’s consumption patterns (food and non-food expenditures) and the mediating role of the Covid-19 pandemic. In light of this reviewed evidence, this study conjectures that digital and financial inclusion positively affect household consumption in Burkina Faso, with the Covid-19 pandemic significantly mediating these effects. Specifically:
- H1: Mobile phone ownership, internet access, and bank account possession positively influence household food (dali) and non-food (dnal) consumption expenditures (Ahamadou & Agada, 2023; Jiang et al., 2024; Senou & Acclassato Houensou, 2024).
- H2: The Covid-19 pandemic amplifies the positive effects of digital and financial inclusion on consumption by increasing reliance on digital financial services (Apeti, 2023; Senou et al., 2019a).
- H3: Socioeconomic factors (education, gender, urban residency) moderate DFI impacts on consumption, with stronger effects in households with higher education and urban access (Compaoré et al., 2025; Koffi & Kouadio, 2024; Ndione et al., 2024; Niankara et al., 2025).
3. Methodology
3.1 Theoretical Framework
The adopted conceptual framework extends the model developed in Niankara (2023), which defines the key factors driving household food and non-food consumption spending as indicators of household economic well-being within WAEMU. In this extended framework, household food and non-food wellness are jointly driven by a combination of external and internal factors, now incorporating digital and financial inclusion as critical internal drivers. Externally, household economic well-being is influenced by: (i) overall regional bloc level influences of monetary policies from the Central Bank of the West African States; (ii) country-level fiscal and social policy effects from national governance; (iii) decentralized, within-country level policy effects from local administrative governance; and (iv) random climate/environmental influences. Internally, household economic well-being is influenced by observed household characteristics, including demographic factors (household size, head’s age, gender), socioeconomic factors (education, literacy, economic sector), and explicitly including digital inclusion (mobile phone ownership, internet access) and financial inclusion (bank account possession), as well as unobserved household characteristics (household-level random influences).
3.2 Empirical Model
At the WAEMU bloc level, with a focus on Burkina Faso, the spatio-temporal process generating household food and non-food consumption spending is expressed as a panel extension of the cross-sectional model in Niankara (2023):
Y_{ijt} = \beta_0 + \beta_1 D_{ijt} + \beta_2 F_{ijt} + \beta_3 T_t + \beta_4 (D_{ijt} \times T_t) + \beta_5 (F_{ijt} \times T_t) + \gamma X_{ijt} + u_j + \epsilon_{ijt}
where Y_{ijt} represents household i’s consumption type j (food or non-food) at time t; D_{ijt} denotes digital inclusion variables (mobile phone ownership, internet access); F_{ijt} denotes financial inclusion (bank account); T_t is a post-pandemic dummy (1 for 2021, 0 for 2018); X_{ijt} are control variables; u_j captures spatial random effects; and \epsilon_{ijt} is the error term.
The copula method jointly models food (dali) and non-food (dnal) expenditures, conditional on drivers including digital/financial inclusion and pandemic interactions. The resulting joint cumulative distribution function is:
F(dali, dnal \mid X) = C(F_1(dali \mid X),\; F_2(dnal \mid X);\; \theta)
where F_1 and F_2 are marginal CDFs (log-normal), C is the Gaussian copula, and \theta is the dependence parameter.
3.3 Data and Variables
The “Enquête Harmonisée sur les Conditions de Vie des Ménages” (EHCVM), conducted in two editions (2018/2019 and 2021/2022), covers all WAEMU member states including AES countries, with two waves per edition to account for consumption seasonality. EHCVM data for Burkina Faso comprise 14,186 households (7,010 in 2018, 7,176 in 2021 after cleaning).
Figure 14 illustrates the national and administrative-regional coverage for Burkina Faso. Table 4 details sample characteristics, and Table 5 provides the full definition of all relevant study variables.
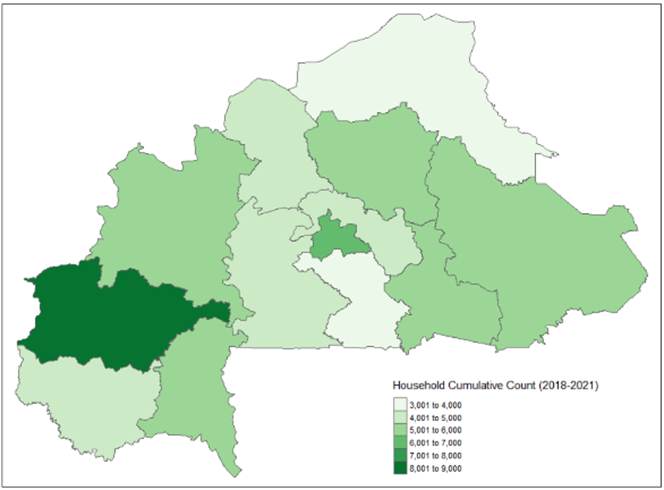
Table 4: Study Data Sample Characteristics
| Country | Ed1 Wave 1 (Urban/Rural) | Ed1 Wave 2 (Urban/Rural) | Ed2 Wave 1 (Urban/Rural) | Ed2 Wave 2 (Urban/Rural) | Retention Rate |
|---|---|---|---|---|---|
| Burkina Faso | 1,577/1,930 | 1,572/1,931 | 1,647/1,938 | 1,691/1,900 | Ed1: 99.15% / Ed2: 100% |
Note: Ed1 WAVE 1: Oct–Dec 2018; WAVE 2: Apr–Jul 2019. Ed2 WAVE 1: Aug–Dec 2021; WAVE 2: Apr–Jul 2022. Total raw sample: Ed1=7,070, Ed2=7,176. Final treated sample: Ed1=7,010, Ed2=7,176.
Table 5: Study Variables Definition and Description
| Variable | Description |
|---|---|
| Year | Year (or edition) of the household survey data collection (2018, 2021) |
| Vague | Wave of the household survey data collection (Wave 1, Wave 2) |
| Region | Responding household’s administrative region of residency (one of 13) |
| Residency | Responding household’s place of residency (rural/urban) |
| hhid | Responding household’s unique identification number |
| hhsize | Responding household’s size (number of people) |
| hgender2 | Gender of the household head (male/female) |
| hage | Age of the household head in years (smooth function) |
| hmstat3 | Marital status of the household head (married, single, divorced, etc.) |
| heduc2 | Education level of the household head (none, primary, secondary, tertiary) |
| hdiploma2 | Highest degree certification received by the household head |
| hhandig2 | Household head’s general health status (whether or not a major handicap) |
| hSectEconAct | Household head’s sector of economic activity (agriculture, services, etc.) |
| IntrnetAcces | Household’s status of internet services access (yes/no) |
| MobPhOwnshp | Household head’s mobile phone ownership status (yes/no) |
| BankAcct | Household head’s formal bank account ownership status (yes/no) |
| educ_hi2 | Highest education level of the head’s spouse |
| diplome2 | Highest diploma received by the household head’s spouse |
| OccupStat12M | Occupational status of household head in the last 12 months |
| HealthProb30D | Health problems experienced by household head in the last 30 days |
| StopActivHlthProb | Whether health problems stopped household head’s activities |
| Host12M | Whether household hosted visitors in the last 12 months |
| HoursWorked12M | Hours worked by household head in the last 12 months |
| SecondEmplyt | Whether household head has secondary employment |
| gender | Gender of the respondent (if different from head) |
| age | Age of the respondent (smooth function) |
| mstat2 | Marital status of the respondent |
| religion2 | Religion of the household head |
| AtndSchoolY | Whether household members attended school in the past year |
| dali | Household’s total expenditure on food consumption (CFA franc, log-normal) |
| dnal | Household’s total expenditure on non-food consumption (CFA franc, log-normal) |
| deptot | Household’s overall nominal consumption expenditures (CFA franc) |
| zref | Official country-level poverty threshold during the year of data collection |
| pcexp | Household’s real per-capita personal consumption expenditure |
| hhweight | Household’s probability weight in the data |
3.4 Expected Effects
Digital and financial inclusion are expected to positively affect consumption (\beta_1, \beta_2 > 0), with pandemic mediation potentially amplifying effects (\beta_4, \beta_5 > 0) due to increased reliance on digital/financial tools post-Covid. Controls like education, urban residency, and occupational status should positively influence outcomes, while health problems may negatively affect consumption.
3.5 Sensitivity Analysis
Table 6 summarizes the sensitivity analysis results for alternative copula models (Gaussian, Clayton, Frank, AMH, FGM). Model selection is based on AIC and BIC, with Vuong and Clarke tests used for pairwise model comparisons. The comparative results reveal the Gaussian copula as best performing (lowest AIC/BIC) (Easton et al., 2022; Krupskii et al., 2020).
Table 6: Sensitivity Analysis Results for Copula Models
| Metric | Gaussian | Clayton | Frank | AMH | FGM |
|---|---|---|---|---|---|
| Largest Abs. Gradient | 0.0050 | 0.0004 | 0.0034 | 0.0002 | 0.3345 |
| Info. Matrix | Pos. Def. | Pos. Def. | Pos. Def. | Pos. Def. | Pos. Def. |
| Eigenvalue Range | [106, 3.9e14] | [124, 3.4e14] | [114, 3.8e14] | [128, 3.2e14] | [0.006, 2.4e14] |
| Trust Iter. (Pre) | 5 | 6 | 5 | 7 | 30 |
| Smoothing Loops | 2 | 2 | 2 | 2 | 1 |
| Trust Iter. (Post) | 6 | 7 | 7 | 9 | 14 |
| Degrees of Freedom | 245.0 | 245.0 | 245.0 | 245.0 | 230.0 |
| AIC/BIC (×10⁹) | 2.43 | 2.43 | 2.43 | 2.43 | 2.43 |
Vuong and Clarke Test Results:
- Gaussian vs. Frank → V: Gaussian, C: Frank
- Frank vs. AMH → V: Frank, C: Frank
- AMH vs. Clayton → V: AMH, C: AMH
- Clayton vs. FGM → V: Clayton, C: Clayton
- FGM vs. Gaussian → V: Gaussian, C: Gaussian
Note: “V”=Vuong’s test, “C”=Clarke’s test. AIC/BIC values (×10⁹) rounded. “Pos. Def.”=Positive Definite.
4. Results
4.1 Descriptive Statistics
The summary statistics describing the key variables are presented in Tables 7 and 8. Table 7 presents summary statistics for quantitative variables.
Table 7: Descriptive Statistics for Quantitative Variables
| Variable | Min | 1st Qu. | Median | Mean | 3rd Qu. | Max | SD |
|---|---|---|---|---|---|---|---|
| dali | 17,857 | 592,193 | 925,411 | 1,200,291 | 1,466,311 | 16,835,943 | 1,038,260 |
| dnal | 58,281 | 618,399 | 983,261 | 1,331,829 | 1,610,265 | 14,563,263 | 1,189,773 |
| dtot | 83,213 | 1,292,874 | 1,966,271 | 2,532,119 | 3,075,955 | 20,478,110 | 2,020,325 |
| pcexp | 34,775 | 167,162 | 248,171 | 329,833 | 385,378 | 10,279,718 | 292,232 |
| hage | 16 | 39 | 48 | 49.62 | 59 | 100 | 14.03 |
| age | 0 | 7 | 16 | 22.58 | 34 | 110 | 19.22 |
| hhsize | 1 | 5 | 8 | 9.03 | 11 | 51 | 5.52 |
| HoursWorked12M | 0 | 0 | 0 | 508.9 | 832 | 5,760 | 898.26 |
| hhweight | 21.4 | 182.9 | 434.5 | 619.1 | 791.4 | 7,869.6 | 659.99 |
Table 8 provides relative frequency distributions for qualitative variables. For digital inclusion, 38.28% of households report mobile phone ownership, while only 8.00% have internet access, reflecting limited digital penetration. Financial inclusion is similarly low, with 15.04% of households having bank account access. Education levels show 59.52% of households with no education, 29.19% with primary, 10.18% with secondary, and only 1.11% with higher education. The sample splits 67.10% of observations from 2018 and 32.90% from 2021.
Table 8: Descriptive Statistics for Qualitative Variables (Relative Frequencies, %)
| Variable | Category 1 | Category 2 | Category 3 | Category 4 | Category 5 |
|---|---|---|---|---|---|
| MobPhOwnshp | No: 61.72 | Yes: 38.28 | |||
| IntrnetAcces | No: 92.00 | Yes: 8.00 | |||
| BankAcct | No: 84.96 | Yes: 15.04 | |||
| year | 2018: 67.10 | 2021: 32.90 | |||
| educ_hi2 | None: 59.52 | Primary: 29.19 | Secondary: 10.18 | Higher: 1.11 | |
| diplome2 | None: 82.75 | Elem. Cert.: 11.75 | Mid Cert.: 3.68 | High Cert.: 0.95 | Univ. Cert.: 0.88 |
| OccupStat12M | Active: 32.09 | <5yo: 28.84 | Not Active: 27.49 | Farming: 11.59 | |
| HealthProb30D | No: 71.14 | Yes: 28.86 | |||
| StopActivHlthProb | No: 83.03 | Yes: 16.97 | |||
| Host12M | No: 95.45 | Yes: 4.55 | |||
| SecondEmplyt | No: 87.92 | Yes: 12.08 | |||
| gender | Female: 52.52 | Male: 47.48 | |||
| mstat2 | Not Married: 66.67 | Married: 33.33 | |||
| religion2 | Others: 0.46 | Muslim: 64.11 | Christian: 28.07 | Animist: 7.36 | |
| AtndSchoolY | No: 74.79 | Yes: 25.21 | |||
| hgender2 | Female: 10.42 | Male: 89.58 | |||
| hmstat3 | Not Married: 10.69 | Monogamous: 53.53 | Polygamous: 35.78 | ||
| hreligion2 | Others: 0.46 | Muslim: 64.07 | Christian: 26.30 | Animist: 9.16 | |
| heduc2 | None: 73.81 | Primary: 16.39 | Secondary: 7.55 | Higher: 2.26 | |
| hdiploma2 | None: 84.85 | Elem. Cert.: 8.02 | Mid Cert.: 3.91 | High Cert.: 1.08 | Univ. Cert.: 2.15 |
| hhandig2 | None: 93.73 | MHandicap: 6.27 | |||
| hSectEconAct | Not Active: 9.29 | Primary: 57.88 | Tertiary: 13.64 | Secondary: 9.80 | Commerce: 9.41 |
| Residency | Rural: 60.44 | Urban: 39.56 |
4.2 Econometric Results
Table 9 summarizes the parametric coefficients for the mean equations of food (dali) and non-food (dnal) consumption expenditures. Table 10 presents the coefficients for the variance equations (\sigma_1, \sigma_2) and the covariance equation (\theta).
4.2.1 Digital and Financial Inclusion — Mean Food Consumption
DFI favorably drives households’ mean food consumption spending (dali) in Burkina Faso. Compared to the pre-pandemic era, household mean expenditure on food consumption was 30.42% higher overall in 2021 (\text{year2021}: 0.3042, p < 0.001). Mobile phone ownership directly contributes to 6.77% higher mean food consumption (\text{MobPhOwnshpYes}: 0.0677, p < 0.001), but pandemic mediation shows a 0.54% lower impact in 2021 (\text{MobPhOwnshpYes:year2021}: -0.0054, p < 0.001). Internet access directly increases mean food consumption by 12.28% (p < 0.001) and records a 7.07% indirect boost post-pandemic (p < 0.001). Bank account access directly contributes to 10.26% higher mean food expenditure (p < 0.001), despite a 9.64% adverse impact in the post-Covid era (p < 0.001).
4.2.2 Digital and Financial Inclusion — Mean Non-Food Consumption
A similar pattern is observed for mean non-food consumption (dnal). Mean non-food expenditure was 14.65% higher in 2021 (p < 0.001). Mobile phone ownership contributes to 18.29% higher mean non-food spending (p < 0.001), with a 3.27% lower pandemic-mediated impact in 2021. Internet access increases non-food consumption by 14.72% directly and exhibits a 12.62% indirect boost post-pandemic (both p < 0.001). Bank account access contributes to 12.66% higher mean non-food spending despite a 6.08% reduced impact post-pandemic.
4.2.3 Digital and Financial Inclusion — Variance of Food Consumption
Digital inclusion increases the variance of food consumption, while financial inclusion reduces it. Bank account access directly reduces variations in food consumption by 5.33% (p < 0.001). Mobile phone ownership and internet access increase variations by 1.31% and 4.90%, respectively (p < 0.001). The post-pandemic era exhibits 6.60% lower variations in food consumption compared to pre-pandemic times.
4.2.4 Digital and Financial Inclusion — Variance of Non-Food Consumption
For non-food consumption variance (\sigma_2), findings show mixed impacts. Bank account ownership increases variations in non-food consumption by 2.07%. Mobile phone ownership reduces variations by 0.81%, while internet access increases them by 9.35% (p < 0.001). The post-pandemic era shows 5.67% higher variations in non-food consumption.
4.2.5 Digital and Financial Inclusion — Covariance Between Food and Non-Food Consumption
Bank account ownership reduces the covariance by 3.07%, while mobile phone ownership and internet access increase it by 1.58% and 2.90%, respectively (p < 0.001). The overall covariance (\theta = 0.564, \tau = 0.383) indicates a strong interdependence between food and non-food expenditures.
Table 9: Estimated Effects for Mean Equations (Food and Non-Food Consumption)
| Variable | Food (dali) Estimate | Food p-value | Non-Food (dnal) Estimate | Non-Food p-value |
|---|---|---|---|---|
| (Intercept) | 12.67 | <2e-16 | 12.69 | <2e-16 |
| MobPhOwnshpYes | 0.0677 | <2e-16 | 0.1829 | <2e-16 |
| year2021 | 0.3042 | <2e-16 | 0.1465 | <2e-16 |
| IntrnetAccesYes | 0.1228 | <2e-16 | 0.1472 | <2e-16 |
| BankAcctYes | 0.1026 | <2e-16 | 0.1266 | <2e-16 |
| educ_hi2Primary | 0.0123 | <2e-16 | 0.0007 | 0.0072 |
| educ_hi2Secondary | 0.0074 | <2e-16 | 0.0113 | <2e-16 |
| educ_hi2Higher | -0.0795 | <2e-16 | -0.0869 | <2e-16 |
| diplome2AtMostElemt Sch. Cert. | -0.0194 | <2e-16 | 0.0240 | <2e-16 |
| diplome2AtMostMid Sch. Cert. | -0.0168 | <2e-16 | 0.0226 | <2e-16 |
| diplome2AtMostHigh Sch. Cert. | -0.0457 | <2e-16 | -0.0205 | <2e-16 |
| diplome2AtLeastU Diploma Cert. | 0.0635 | <2e-16 | 0.1037 | <2e-16 |
| OccupStat12MLess5YearOld | 0.0123 | <2e-16 | -0.0237 | <2e-16 |
| OccupStat12MNotActiv | -0.0395 | <2e-16 | -0.0216 | <2e-16 |
| OccupStat12MFarming | 0.0176 | <2e-16 | 0.0023 | 1.81e-08 |
| HealthProb30DYes | 0.0472 | <2e-16 | 0.0500 | <2e-16 |
| StopActivHlthProbYes | 0.0308 | <2e-16 | 0.0312 | <2e-16 |
| Host12MYes | 0.1157 | <2e-16 | 0.0871 | <2e-16 |
| HoursWorked12M | 1.34e-05 | <2e-16 | 8.77e-07 | 1.19e-10 |
| SecondEmplytYes | 0.0666 | <2e-16 | 0.0374 | <2e-16 |
| genderMale | -0.0256 | <2e-16 | -0.0454 | <2e-16 |
| mstat2Married | -0.0280 | <2e-16 | -0.0222 | <2e-16 |
| religion2Muslim | -0.0629 | <2e-16 | -0.0588 | <2e-16 |
| religion2Christian | -0.1173 | <2e-16 | -0.0970 | <2e-16 |
| religion2Animist | -0.1672 | <2e-16 | -0.0852 | <2e-16 |
| AtndSchoolYYes | 0.0773 | <2e-16 | 0.1393 | <2e-16 |
| hgender2Male | 0.1757 | <2e-16 | 0.2461 | <2e-16 |
| hmstat3Monogamous | -0.0025 | 5.89e-12 | 0.0499 | <2e-16 |
| hmstat3Polygamous | 0.0573 | <2e-16 | 0.1260 | <2e-16 |
| hreligion2Muslim | 0.2003 | <2e-16 | 0.1394 | <2e-16 |
| hreligion2Christian | 0.1637 | <2e-16 | 0.1805 | <2e-16 |
| hreligion2Animist | 0.1475 | <2e-16 | 0.0392 | <2e-16 |
| heduc2Primary | 0.0487 | <2e-16 | 0.1307 | <2e-16 |
| heduc2Secondary | 0.0957 | <2e-16 | 0.1485 | <2e-16 |
| heduc2Higher | -0.1142 | <2e-16 | 0.2349 | <2e-16 |
| hdiploma2AtMostElemt Sch. Cert. | -0.0200 | <2e-16 | 0.0610 | <2e-16 |
| hdiploma2AtMostMid Sch. Cert. | 0.1317 | <2e-16 | 0.3264 | <2e-16 |
| hdiploma2AtMostHigh Sch. Cert. | 0.3968 | <2e-16 | 0.4048 | <2e-16 |
| hdiploma2AtLeastU Diploma Cert. | 0.5491 | <2e-16 | 0.5233 | <2e-16 |
| hhandig2MHandicap | 0.0087 | <2e-16 | 0.0402 | <2e-16 |
| hSectEconActPrimary | -0.0405 | <2e-16 | -0.1587 | <2e-16 |
| hSectEconActTertiary | 0.0483 | <2e-16 | -0.0036 | <2e-16 |
| hSectEconActSecondary | 0.0370 | <2e-16 | 0.0051 | <2e-16 |
| hSectEconActCommerce | 0.0946 | <2e-16 | 0.0702 | <2e-16 |
| hhsize | 0.0582 | <2e-16 | 0.0537 | <2e-16 |
| ResidencyUrban | 0.2515 | <2e-16 | 0.3873 | <2e-16 |
| MobPhOwnshpYes:year2021 | -0.0054 | <2e-16 | -0.0327 | <2e-16 |
| year2021:IntrnetAccesYes | 0.0707 | <2e-16 | 0.1262 | <2e-16 |
| year2021:BankAcctYes | -0.0964 | <2e-16 | -0.0608 | <2e-16 |
| s(age) — edf | 8.999 | <2e-16 | 8.998 | <2e-16 |
| s(hage) — edf | 8.989 | <2e-16 | 9.000 | <2e-16 |
| s(regionID) — edf | 12.000 | <2e-16 | 12.000 | <2e-16 |
Note: Estimates for smooth terms represent effective degrees of freedom (edf). All coefficients are significant at p < 0.001 unless otherwise noted.
Table 10: Estimated Effects for Variance and Covariance Equations
| Variable | Var. σ₁ (Food) Est. | σ₁ p | Var. σ₂ (Non-Food) Est. | σ₂ p | Cov. θ Est. |
|---|---|---|---|---|---|
| (Intercept) | -0.603 | <0.001 | -0.734 | <0.001 | 0.591 |
| MobPhOwnshpYes | 0.013 | <0.001 | -0.008 | <0.001 | 0.016 |
| year2021 | -0.066 | <0.001 | 0.057 | <0.001 | 0.043 |
| IntrnetAccesYes | 0.049 | <0.001 | 0.094 | <0.001 | 0.029 |
| BankAcctYes | -0.053 | <0.001 | 0.021 | <0.001 | -0.031 |
| educ_hi2Primary | -0.015 | <0.001 | -0.019 | <0.001 | — |
| educ_hi2Secondary | -0.067 | <0.001 | -0.088 | <0.001 | — |
| educ_hi2Higher | -0.126 | <0.001 | -0.079 | <0.001 | — |
| AtMostElemt Sch. Cert. | 0.013 | <0.001 | 0.013 | <0.001 | — |
| AtMostMid Sch. Cert. | 0.026 | <0.001 | 0.007 | <0.001 | — |
| AtMostHigh Sch. Cert. | 0.063 | <0.001 | 0.082 | <0.001 | — |
| AtLeastU Diploma | 0.219 | <0.001 | 0.192 | <0.001 | — |
| OccupStat: <5YearOld | -0.004 | <0.001 | -0.054 | <0.001 | — |
| OccupStat: NotActiv | -0.017 | <0.001 | -0.048 | <0.001 | — |
| OccupStat: Farming | -0.038 | <0.001 | -0.041 | <0.001 | — |
| HealthProb30DYes | 0.030 | <0.001 | 0.013 | <0.001 | — |
| StopActivHlthProbYes | -0.008 | <0.001 | 0.005 | <0.001 | — |
| ResidencyUrban | -0.016 | <0.001 | 0.125 | <0.001 | 0.095 |
| MobPhOwnshp:2021 | -0.028 | <0.001 | -0.017 | <0.001 | -0.009 |
| 2021:IntrnetAcces | -0.040 | <0.001 | -0.083 | <0.001 | 0.011 |
| 2021:BankAcct | 0.022 | <0.001 | -0.063 | <0.001 | -0.015 |
| σ₁ [95% CI] | 0.527 (0.527, 0.528) | ||||
| σ₂ [95% CI] | 0.495 (0.494, 0.496) | ||||
| θ [95% CI] | 0.564 (0.563, 0.565) | ||||
| τ [95% CI] | 0.383 (0.383, 0.384) |
Note: All coefficients significant at p < 0.001. Var. = Variance, Cov. = Covariance. Smooth term s(regionID): edf = 12.000, p < 0.001 for all equations.
4.3 Findings in Context
The results demonstrate that DFI significantly influences household food and non-food consumption in Burkina Faso, with notable pandemic mediation. Mobile phone ownership increases food expenditure by 6.77% and non-food by 18.29%, aligning with Senou & Acclassato Houensou (2024) and Coulibaly (2021), who found that mobile money adoption in WAEMU countries enhances financial access and boosts household consumption. Internet access boosts food expenditure by 12.28% and non-food by 14.72%, consistent with Senou et al. (2019a), who highlight the role of digital technologies in expanding financial inclusion in WAEMU. Bank account ownership enhances food expenditure by 10.26% and non-food by 12.66%, corroborating Ouedraogo & Thiombiano (2025) and Takouda et al. (2022), who note that formal financial inclusion in WAEMU supports human development and economic stability.
The Covid-19 pandemic significantly mediates these effects. Negative interaction effects in 2021 for mobile phone ownership and bank account ownership suggest a pandemic-induced moderation, likely due to disrupted economic activities, supply chain constraints, or reduced income flows, a pattern noted in African contexts by Apeti (2023). Conversely, the positive interaction for internet access in 2021 underscores its growing importance post-pandemic, likely driven by increased reliance on digital platforms for remote transactions, information access, and financial services (Ahamadou & Agada, 2023; Dianda, Thiombiano, & Okey, 2025).
The variance equations reveal that DFI reduces volatility in food consumption (\sigma_1 = 0.527) but increases it in non-food consumption (\sigma_2 = 0.495), consistent with Lai et al. (2020), who found that DFI smooths transitory income shocks but may increase consumption sensitivity. The positive covariance (\theta = 0.564, \tau = 0.383) underscores a strong interdependence between food and non-food spending, aligning with Niankara (2023), who emphasize integrated household consumption patterns in WAEMU.
5. Implications
5.1 Theoretical Implications
This study significantly advances platform ecosystem theory by embedding DFI within the socio-economic fabric of Burkina Faso. The findings illuminate how digital platforms—mobile phones and internet access—alongside financial systems like bank accounts foster adaptive household responses to exogenous shocks, notably the Covid-19 pandemic (Niankara et al., 2023; Senou & Acclassato Houensou, 2024). The smooth term for regional effects (s(\text{regionID}), edf = 12, p < 0.001) captures localized economic variations across Burkina Faso’s 13 diverse administrative regions, aligning with Takouda et al. (2022) and Takouda et al. (2020), who highlight regional disparities in financial inclusion within WAEMU. The strong covariance between food and non-food expenditures (\theta = 0.564, \tau = 0.383) demonstrates how DFI integrates consumption behaviors into a cohesive economic framework, particularly under crisis conditions (Ouedraogo & Thiombiano, 2025; Soro & Senou, 2023).
5.2 Practical Implications
The significant consumption boosts from mobile phone ownership and internet access (e.g., 18.29% increase in non-food expenditure) highlight the potential for businesses to leverage DFI technologies to reduce transaction costs and expand market reach (Dianda, Thiombiano, & Okey, 2025; Obiora & Ozili, 2023). Firms can develop targeted marketing strategies, such as mobile-based advertising or e-commerce platforms, particularly in urban areas where residency amplifies consumption (25.15% for food, 38.73% for non-food). In rural areas where 60.44% of households reside, mobile platforms can bridge information and market access gaps, enabling households to engage with agricultural markets or digital services, thus improving welfare (Ahamadou & Agada, 2023; Senou & Acclassato Houensou, 2024).
5.3 Policy Implications
Policymakers in Burkina Faso, the Sahel States, and the broader WAEMU region must prioritize digital and financial inclusion to bolster economic resilience and promote inclusive growth. The negative pandemic interaction effects reveal vulnerabilities necessitating robust AI-API governance to ensure platform reliability (Shen et al., 2024; Traoré & Abdou Khadre, 2025). Governments should subsidize mobile data costs, given the 38.28% mobile phone penetration, and expand internet infrastructure (currently 8.00% penetration) (Dianda, Thiombiano, & Okey, 2025; Senou et al., 2019a). Streamlining mobile banking regulations can enhance the 15.04% bank account ownership, reducing food consumption volatility (Takouda et al., 2022). Addressing the 12% gender gap in account ownership and 9 percentage point gap in internet access requires targeted interventions such as financial literacy programs for women and rural communities (Compaoré et al., 2025; Koffi & Kouadio, 2024).
5.4 Sustainable Development Implications
The findings align with multiple SDGs. DFI’s positive effects on household consumption support SDG 9 (Industry, Innovation, and Infrastructure) by promoting development of digital and financial infrastructure critical for economic growth (Traoré & Abdou Khadre, 2025; Yan et al., 2024). Enhanced food expenditure, particularly in urban households (25.15%), contributes to SDG 1 (No Poverty) by improving economic well-being (Ouedraogo & Thiombiano, 2025; Senou & Acclassato Houensou, 2024). The reduction in food consumption volatility aligns with SDG 10 (Reduced Inequalities), as DFI empowers marginalized households to access resources more equitably (Ndione et al., 2024; Soro & Senou, 2023). Addressing gender-specific dynamics in MFS usage (Niankara et al., 2025) supports SDG 5 (Gender Equality). The strong covariance between food and non-food spending supports SDG 12 (Responsible Consumption and Production) by promoting efficient resource use (Ahamadou & Agada, 2023).
6. Conclusions and Future Research
6.1 Summary
This study robustly confirms that digital and financial inclusion, through mobile phone ownership, internet access, and bank account possession, significantly enhances household economic well-being in Burkina Faso, as evidenced by increased food (dali) and non-food (dnal) consumption expenditures. Specifically, mobile phone ownership boosts food consumption by 6.77% and non-food by 18.29%, internet access by 12.28% and 14.72%, and bank account access by 10.26% and 12.66% (all p < 0.001), based on cross-sectional panel data from the 2018 and 2021 waves of the EHCVM (Commission de l’UEMOA, 2023). The Covid-19 pandemic mediated these effects, with internet access amplifying consumption (7.07% for food, 12.62% for non-food), while mobile phone and bank account effects were moderated (-0.54% to -9.64%). The strong covariance between food and non-food spending (\theta = 0.564, \tau = 0.383) underscores their interdependence, highlighting the need for integrated policy approaches (Niankara, 2023; Soro & Senou, 2023).
6.2 Limitations
While the study leverages robust secondary data from the 2018 and 2021 waves of the EHCVM survey, potential measurement errors in self-reported consumption expenditures and the focus on a single AES country may constrain applicability to broader WAEMU contexts (Compaoré et al., 2025; Koffi & Kouadio, 2024). Additionally, the panel data’s two-wave structure limits the ability to capture longer-term trends, and unobserved heterogeneity, despite being modeled via regional smooth terms (s(\text{regionID}), edf = 12, p < 0.001), may still influence results (Ouedraogo & Thiombiano, 2025).
6.3 Future Research
Future research should prioritize longitudinal and up-to-date data collection across multiple WAEMU countries to capture the long-term impacts of DFI on household consumption patterns, building on Takouda et al. (2022) and Coulibaly (2021)’s regional analyses. Experimental designs, such as randomized controlled trials evaluating mobile banking or internet access adoption, could isolate causal effects and address endogeneity concerns. Investigating gender-specific effects, given the 12% gender gap in account ownership and 9 percentage point gap in internet access (Lai et al., 2020; F. Liu & Walheer, 2022; Ndione et al., 2024), could elucidate DFI’s role in reducing inequalities (Soro & Senou, 2023). Comparative studies across AES and non-AES countries could highlight regional variations, informing tailored policy interventions (Ahamadou & Agada, 2023; Dianda, Thiombiano, & Nézan Okey, 2025).
6.4 Closing Remarks
Digital and financial inclusion holds transformative potential for unlocking the benefits of the Fourth Industrial Revolution in Africa, particularly in AES countries like Burkina Faso, where reportedly 38.28% of households own mobile phones, 8.00% have internet access, and 15.04% possess bank accounts (Dianda, Thiombiano, & Okey, 2025; Senou et al., 2019b). By fostering widespread access to digital platforms and financial services, policymakers and firms can drive sustainable economic growth, enhance household resilience, and align with UN SDGs 1 (No Poverty), 9 (Industry, Innovation, and Infrastructure), and 10 (Reduced Inequalities) (Ouedraogo & Thiombiano, 2025; Traoré & Abdou Khadre, 2025).
Declarations
Funding: Not applicable.
Conflict of interest: The author declares no competing interests.
Ethics approval and consent to participate: Not applicable.
Data availability: The data used in this research is available upon reasonable request.
Code availability: R code is available upon reasonable request.
CRediT authorship contribution statement: Conceptualization, methodology, analysis, writing.
References
Ahamadou, M., & Agada, D. B. (2023). Adopting FinTech to promote financial inclusion: Evidence from western african economic and monetary union. International Journal of Applied Economics, Finance and Accounting, 17(1), 135–145. https://doi.org/10.33094/ijaefa.v17i1.1090
Apeti, A. E. (2023). Household welfare in the digital age: Assessing the effect of mobile money on household consumption volatility in developing countries. World Development, 161, 106110. https://doi.org/10.1016/j.worlddev.2022.106110
Aria, M., & Cuccurullo, C. (2017). Bibliometrix: An r-tool for comprehensive science mapping analysis. Journal of Informetrics, 11(4), 959–975.
Commission de l’UEMOA. (2023). Programme d’Harmonisation et de Modernisation des Enquêtes sur les Conditions de Vie des ménages (PHMECV), Enquête Harmonisée sur les Conditions de Vie des Ménages (EHCVM), All 8 WAEMU country members 2018/2019 (1st Ed.) and 2021/2022 (2nd Ed.) – Panel Surveys. Datasets downloaded on December 28, 2023, from https://phmecv.uemoa.int/nada/index.php/catalog.
Compaoré, E. D., Maiga, B., & Guira, A. (2025). Determinants and drivers of financial inclusion in the west african economic and monetary union (WAEMU): A multidimensional analysis. Economic Papers. https://doi.org/10.1111/1759-3441.70000
Coulibaly, S. S. (2021). A study of the factors affecting mobile money penetration rates in the west african economic and monetary union (WAEMU) compared with east africa. Financial Innovation, 7(1). https://doi.org/10.1186/s40854-021-00238-0
Dianda, P., Thiombiano, N. G., & Nézan Okey, M. K. (2025). Barriers to financial inclusion and socioeconomic determinants in west african economic and monetary union (WAEMU) countries: A multivariate analysis. SN Business and Economics, 5(9). https://doi.org/10.1007/s43546-025-00889-6
Dianda, P., Thiombiano, N. G., & Okey, M. K. N. (2025). Electronic money accessibility and financial inclusion in WAEMU countries: Does increased access to electronic money lead to greater financial inclusion? Cogent Economics and Finance, 13(1). https://doi.org/10.1080/23322039.2025.2476089
Easton, A., Dalen, O. van, Goeb, R., & Di Bucchianico, A. (2022). Bivariate copula monitoring. Quality and Reliability Engineering International, 38(3), 1272–1288. https://doi.org/10.1002/qre.3022
Hou, Z., Xu, J., Choi, Y., & Ma, Y. (2024). The impact of digital financial inclusion on household commercial insurance for sustainable governance mechanisms under regional group differences. Sustainability, 16(9), 3596. https://doi.org/10.3390/su16093596
Jiang, W., Hu, Y., & Cao, H. (2024). Does digital financial inclusion increase the household consumption? Evidence from china. Journal of the Knowledge Economy, 1–32. https://doi.org/10.1007/s13132-024-01843-8
Jin, S., Gan, C., & Anh, D. L. T. (2024). Financial inclusion toward economic inclusion: Empirical evidence from china’s rural household. Agricultural Finance Review, 84(1), 67–89. https://doi.org/10.1108/AFR-05-2023-0057
Koffi, M. V., & Kouadio, K. A. A. (2024). Level of education and financial inclusion in the west african economic and monetary union (WAEMU). Pakistan Journal of Life and Social Sciences, 22(2), 2402–2410. https://doi.org/10.57239/PJLSS-2024-22.2.00174
Krupskii, P., Harrou, F., Hering, A. S., & Sun, Y. (2020). Copula-based monitoring schemes for non-gaussian multivariate processes. Journal of Quality Technology, 52(3), 219–234. https://doi.org/10.1080/00224065.2019.1679408
Lai, J. T., Yan, I. K., Yi, X., & Zhang, H. (2020). Digital financial inclusion and consumption smoothing in china. China & World Economy, 28(1), 64–93. https://doi.org/10.1111/cwe.12312
Li, X., & Sui, S. (2023). Unraveling the influence and mechanism of digital inclusive finance on household financial substitution: Evidence from china. Asia Pacific Journal of Marketing and Logistics, 35(10), 2466–2483. https://doi.org/10.1108/APJML-11-2022-0942
Lin, H., & Zhang, Z. (2023). The impacts of digital finance development on household income, consumption, and financial asset holding: An extreme value analysis of china’s microdata. Personal and Ubiquitous Computing, 27(4), 1607–1627. https://doi.org/10.1007/s00779-023-01728-8
Liu, F., & Walheer, B. (2022). Financial inclusion, financial technology, and economic development: A composite index approach. Empirical Economics, 63(3), 1457–1487. https://doi.org/10.1007/s00181-021-02178-1
Liu, L., & Guo, L. (2023). Digital financial inclusion, income inequality, and vulnerability to relative poverty. Social Indicators Research, 170(3), 1155–1181. https://doi.org/10.1007/s11205-023-03245-z
Liu, Y., Liu, C., & Zhou, M. (2021). Does digital inclusive finance promote agricultural production for rural households in china? Research based on the chinese family database (CFD). China Agricultural Economic Review, 13(2), 475–494. https://doi.org/10.1108/CAER-06-2020-0141
Lu, X., Guo, J., & Zhou, H. (2021). Digital financial inclusion development, investment diversification, and household extreme portfolio risk. Accounting & Finance, 61(5), 6225–6261. https://doi.org/10.1111/acfi.12863
Lu, X., Lai, Y., & Zhang, Y. (2023). Digital financial inclusion and investment diversification: Evidence from china. Accounting & Finance, 63, 2781–2799. https://doi.org/10.1111/acfi.13043
Luo, J., & Li, B. Z. (2022). Impact of digital financial inclusion on consumption inequality in china. Social Indicators Research, 163(2), 529–553. https://doi.org/10.1007/s11205-022-02876-6
Ma, J., Li, G., Chen, P., & Li, D. (2023). How does digital financial inclusion affect farmers’ choice of agricultural mechanisation: Evidence from china. Technology Analysis & Strategic Management, 1–14. https://doi.org/10.1080/09537325.2023.2234499
Mumtaz, M. Z. (2024). Financial inclusion, digital finance and agricultural participation. Agricultural Finance Review, 84(2/3), 93–113.
Ndione, M., Ashta, A., & Bako Liba, B. B. (2024). Banks, microfinance institutions and fintech: How the ratio of male and female entrepreneurs moderates their capacity for financial inclusion. Cogent Economics and Finance, 12(1). https://doi.org/10.1080/23322039.2024.2402031
Niankara, I. (2023). Socioeconomic and geospatial determinants of households’ food and non-food consumption dynamics within the west african economic and monetary union. Scientific African, 20, e01724. https://doi.org/10.1016/j.sciaf.2023.e01724
Niankara, I., El Refae, G. A., & Qasim, A. (2023). A spatial bivariate copula regression analysis of youths’ access to ICT resources and subjective well-being in the middle east. International Journal of Economics and Business Research, 26(1), 43–83. https://doi.org/10.1504/IJEBR.2023.132254
Niankara, I., Rahrouh, M. N., & Traoret, R. I. (2025). Formal financial inclusion and the nexus between access to mobile and smart telecommunication services and usage of mobile financial services among women in burkina faso post-COVID-19 era. Human Behavior and Emerging Technologies, (1), 6040068. https://doi.org/https://doi.org/10.1155/hbe2/6040068
Obiora, K., & Ozili, P. K. (2023). Benefits of digital-only financial inclusion. In The impact of AI innovation on financial sectors in the era of industry 5.0 (pp. 261–269). IGI Global. https://doi.org/10.4018/979-8-3693-0835-6.ch013
Ouedraogo, H., & Thiombiano, N. G. (2025). Financial inclusion and human development in the west african economic and monetary union (WAEMU): The role of institutional quality. Cogent Economics and Finance, 13(1). https://doi.org/10.1080/23322039.2025.2452888
Peng, P., & Mao, H. (2023). The effect of digital financial inclusion on relative poverty among urban households: A case study on china. Social Indicators Research, 165(2), 377–407. https://doi.org/10.1007/s11205-022-03019-z
Senou, M. M., & Acclassato Houensou, D. (2024). From expanding financial services to tackling poverty in west african economic and monetary union: The accelerating role of mobile money. Journal of International Development, 36(3), 1707–1737. https://doi.org/10.1002/jid.3881
Senou, M. M., Ouattara, W., & Acclassato Houensou, D. (2019a). Financial inclusion dynamics in WAEMU: Was digital technology the missing piece? Cogent Economics and Finance, 7(1). https://doi.org/10.1080/23322039.2019.1665432
Senou, M. M., Ouattara, W., & Acclassato Houensou, D. (2019b). Is there a bottleneck for mobile money adoption in WAEMU? Transnational Corporations Review, 11(2), 143–156. https://doi.org/10.1080/19186444.2019.1641393
Shen, Y., Agyekum, F., Reddy, K., & Wallace, D. (2024). The welfare impact of financial inclusion: A research agenda. Journal of Accounting Literature. https://doi.org/10.1108/JAL-10-2023-0190
Soro, K., & Senou, M. M. (2023). Digital financial inclusion and income inequality in WAEMU: What causality for what heterogeneity? Cogent Economics and Finance, 11(2). https://doi.org/10.1080/23322039.2023.2242662
Takouda, P. M., Dia, M., & Ouattara, A. (2020). Levels of financial inclusion in the WAEMU countries: A case study using DEA. 1274–1278. https://doi.org/10.1109/DASA51403.2020.9317164
Takouda, P. M., Dia, M., & Ouattara, A. (2022). Financial inclusion in west african economic and monetary union’s economies: Performance analysis using data envelopment analysis. Journal of Risk and Financial Management, 15(12). https://doi.org/10.3390/jrfm15120605
Tian, Y., & Guo, L. H. (2022). Does digital financial inclusion alleviate income gap? Empirical evidence from china panel studies. Modern Economic Science, 6, 57–70.
Traoré, A., & Abdou Khadre, D. (2025). Financial inclusion, ICT development and economic growth in WAEMU countries: Evidence of governance. African Journal of Economic and Management Studies, 16(2), 237–254. https://doi.org/10.1108/AJEMS-02-2023-0071
Wang, X., & Fu, Y. (2022). Digital financial inclusion and vulnerability to poverty: Evidence from chinese rural households. China Agricultural Economic Review, 14(1), 64–83. https://doi.org/10.1108/CAER-08-2020-0189
Wang, X., & Wang, X. (2022). Digital financial inclusion and household risk sharing: Evidence from china’s digital finance revolution. China Economic Quarterly International, 2(4), 334–348. https://doi.org/10.1016/j.ceqi.2022.11.006
Yan, Z., Xiao, J. J., & Sun, Q. (2024). Moving up toward sustainable development: Digital finance and income mobility. Sustainable Development. https://doi.org/10.1002/sd.2996
Ye, Y., Pu, Y., & Xiong, A. (2022). The impact of digital finance on household participation in risky financial markets: Evidence-based study from china. PLoS One, 17(4), e0265606. https://doi.org/10.1371/journal.pone.0265606