library(GJRM)

# Define model formulas
f1 <- OverDraftFacility ~ OBapp * ChecAndORSavAccOwnshp + iCert + DigitStratg2 +
      extAudit + AccsToFinObstOP + s(nyearsOper) + legalStat + size + sector_MS +
      s(region, bs = "re") + largFirm + femOwner + s(MangYrExpSect) +
      s(PercSenManTimGovReg) + PraCompInfSec + TaxRates + TranspObstOP +
      PolInstab + PolCorupt + s(year, bs = "re")
# f2 and f3 use same controls

# Primary estimations: Gaussian copula
copula_model_prob13 <- gjrm(list(f1, f3), margins = c("probit", "N"),
                            model = "B", copula = "N", data = pov14)
copula_model_prob23 <- gjrm(list(f2, f3), margins = c("probit", "N"),
                            model = "B", copula = "N", data = pov14)
copula_model_log13  <- gjrm(list(f1, f3), margins = c("logit",  "N"),
                            model = "B", copula = "N", data = pov14)
copula_model_log23  <- gjrm(list(f2, f3), margins = c("logit",  "N"),
                            model = "B", copula = "N", data = pov14)

# Robustness checks: Gumbel and Clayton copulas
copula_model_log_gum13  <- gjrm(list(f1, f3), margins = c("logit",  "N"),
                                model = "B", copula = "G0", data = pov14)
copula_model_log_clay13 <- gjrm(list(f1, f3), margins = c("logit",  "N"),
model = "B", copula = "C0", data = pov14)Open Banking Maturity, Financial Inclusion, and Firm Productivity: Global Evidence from Enterprise Surveys
Digitalization Inclusion and Development
Explores how national Open Banking maturity and firm-level financial inclusion jointly influence credit access (overdraft facilities and loans/credit lines) and labor productivity worldwide, using World Bank Enterprise Survey data from 113,089 firms across 148 countries and a copula-based generalized joint regression model (GJRM).
Abstract
This study explores how national Open Banking maturity and firm-level financial inclusion influence credit access and labor productivity worldwide. Using firm-level data from the World Bank Enterprise Surveys and a novel Open Banking maturity index, we apply a copula-based generalized joint regression model (GJRM) to account for the interdependence between credit access and productivity. Results show that live Open Banking systems increase firms’ likelihood of obtaining overdraft facilities (by 32.78%) and loans/credit lines (by 26.65%). Financial inclusion, measured through checking or savings account ownership, further strengthens these effects, particularly for small and medium-sized enterprises (SMEs) in developing economies. However, mature systems exhibit negative interaction effects, reflecting regulatory and trust-related challenges that temper productivity gains (5.97–5.98%). These findings provide actionable insights for policymakers, financial institutions, and businesses to refine digital and regulatory frameworks, promoting inclusive and sustainable growth in line with SDGs 8, 9, 5, and 16.
Keywords: Open Banking, Financial Inclusion, Firm Performance, Operational Credit, Labor Productivity
JEL Codes: C35, D24, G28, J24, L26, O33
1. Introduction
In an era defined by digital transformation, Open Banking has emerged as a revolutionary force in financial systems, fundamentally reshaping how firms access credit and compete in the global economy (Casolaro et al., 2024). By leveraging secure, consent-based data sharing through application programming interfaces (APIs), Open Banking fosters innovation, enhances competition, and streamlines credit allocation (Dinckol et al., 2023; Gillani et al., 2025; He et al., 2023). Concurrently, financial inclusion, particularly firm-level ownership of formal checking or savings accounts, remains a cornerstone for engaging with formal financial systems (Charfeddine & Zaouali, 2022; Demirguc-Kunt et al., 2018). Small and medium-sized enterprises (SMEs), which account for over 90% of businesses and 50% of employment globally (Tanchangya et al., 2025), stand to benefit most from these advancements (Li & Liu, 2024).
Access to finance has historically constrained firm growth, particularly for SMEs in developing economies, where traditional lending models rely on limited, opaque data, often excluding viable businesses (Jin & Liu, 2024; Okijie & Effiong, 2024; Tanchangya et al., 2025). Open Banking emerges as a disruptor to this paradigm, enabling real-time, data-driven credit assessments, fostering transparency and competition (Borgogno & Manganelli, 2021; Dinckol et al., 2023). As of 2025, over 60 countries have adopted Open Banking frameworks, categorized as “Live” (e.g., UK, EU), “In Development,” or “No Official Initiative” (Biehl, 2023). Advanced economies with mature Open Banking systems report up to 30% higher SME credit access compared to less developed systems (Johri et al., 2024; Preziuso et al., 2023a). Meanwhile, financial inclusion has progressed, with 76% of firms globally holding formal accounts, though only 60% of SMEs in developing economies are included (Li & Liu, 2024; World Bank, 2022).
These trends highlight Open Banking’s potential to amplify financial inclusion’s benefits, yet empirical evidence linking these factors to firm-level outcomes remains scarce (Preziuso et al., 2023a). The extant literature on Open Banking primarily focuses on consumer finance, regulatory frameworks, or technical implementation, with limited attention to firm-level outcomes (Grassi et al., 2022; Niankara et al., 2025). Studies on financial inclusion often emphasize individual-level access, overlooking how firm-level account ownership interacts with macro-level financial innovations (Demirguc-Kunt et al., 2018; Rastogi et al., 2023). Moreover, while labor productivity drives economic growth, few studies explore how financial technologies like Open Banking enhance firm efficiency through improved credit access (Fang & Zhu, 2023; X. Liu & Zhao, 2024). The absence of a unified framework integrating institutional economics, financial inclusion, and firm performance represents a critical gap, particularly in understanding how national policies shape microeconomic outcomes across diverse economic contexts (Marín & Schwabe, 2019; Niankara & Traoret, 2023).
This study bridges these gaps by examining how national Open Banking maturity interacts with firm-level financial inclusion to influence two key outcomes: (1) access to operational credit (overdraft facilities and loans/credit lines) and (2) labor productivity. It addresses the following pivotal research question: How does national Open Banking maturity interact with firm-level financial inclusion to affect firms’ access to operational credit and labor productivity in the global economy? Leveraging cross-country data from the World Bank Enterprise Surveys and a novel dataset classifying Open Banking maturity (Biehl, 2023), the study employs a copula-based generalized joint regression model (GJRM) to capture the interdependence of credit access (binary outcome) and labor productivity (continuous outcome) (Wojtys et al., 2018). The objectives are to:
- Quantify the direct effects of Open Banking maturity and financial inclusion on firms’ access to overdraft facilities and loans/credit lines.
- Evaluate the synergistic effect of Open Banking maturity and account ownership on credit access.
- Assess the downstream impact of these factors on labor productivity, with a focus on SMEs in developing economies.
The research offers three significant contributions. First, it provides a pioneering global analysis of how Open Banking maturity interacts with financial inclusion to drive firm-level outcomes, extending the literature on financial innovation and economic development (He et al., 2023; Niankara & Traoret, 2023). Second, it advances methodological rigor by applying copula-based GJRM to interdependent outcome measures, offering a novel approach for firm operational performance assessment (Wojtys et al., 2018). Third, it delivers actionable insights for policymakers, financial institutions, and firms, demonstrating how Open Banking can amplify financial inclusion, enhance credit access, and boost productivity, particularly in emerging markets (Preziuso et al., 2023a; Rastogi et al., 2023).
2. Literature Review
2.1 Open Banking and Financial Innovation
Open Banking, characterized by secure, API-driven data sharing, has transformed financial systems by fostering competition, transparency, and innovation in credit allocation (Borgogno & Manganelli, 2021; Dinckol et al., 2023). Preziuso et al. (2023b) report that mature Open Banking systems in advanced economies, such as the Netherlands under the EU’s PSD2 framework, increase SME credit access by up to 30% compared to regions with nascent frameworks, though challenges remain in addressing the needs of underserved groups due to regulatory and trust-related barriers. Z. Liu et al. (2024) find that inclusive FinTech and Open Banking in China improve bank performance by enhancing lending rates and liability structures, particularly for national and rural banks serving excluded populations. Broby (2021) provides a framework emphasizing that Open Banking and financial technology innovations reshape financial intermediation, with strategies like customer retention and banking-as-a-service being pivotal. Additionally, Nazaritehrani & Mashali (2020) demonstrate that innovative e-banking channels, such as internet banking and point-of-sale systems, significantly increase banks’ market share in developing countries like Iran.
However, the literature primarily focuses on consumer finance or regulatory aspects, with limited exploration of firm-level outcomes (Grassi et al., 2022; Niankara et al., 2025). Emerging research suggests that Open Banking maturity varies globally, with countries like the UK and EU classified as “Live,” while many developing nations remain in the “In Development” or “No Official Initiative” stages (Biehl, 2023). This disparity underscores the need to examine how national Open Banking maturity, combined with fintech innovations and institutional frameworks, influences firm-level financial inclusion and performance.
2.2 Financial Inclusion and Firm-Level Outcomes
Financial inclusion, defined as access to and use of formal financial services such as checking or savings accounts, is critical for firm growth, particularly for SMEs (Charfeddine & Zaouali, 2022; Demirguc-Kunt et al., 2018). World Bank (2022) notes that 76% of firms globally hold formal accounts, but only 60% of SMEs in developing economies are financially included. Research by Norden & Ribeiro (2025) demonstrates that digital connectivity and education enhance local credit availability, mitigating informational asymmetries and transaction costs. Similarly, Han et al. (2025) finds that digital financial inclusion fosters non-farm employment by improving credit access. Ha et al. (2025) conducted a systematic literature review identifying key research clusters including the advent of novel fintech services, transformation of market landscapes, and the roles of stakeholders in the fintech ecosystem. Furthermore, Vo (2025) investigates the long-term effects of institutional quality on financial inclusion in Asia–Pacific countries, finding that improvements in institutional quality significantly enhance financial inclusion, with stronger impacts in high-income countries.
2.3 Access to Operational Credit
Access to operational credit, including overdraft facilities and loans/credit lines, is a key determinant of firm performance (Brixiová et al., 2020; Weber & Musshoff, 2013). Parameswaran & Kadam (2025) finds that women-owned enterprises in India are significantly less likely to obtain formal credit, highlighting disparities in credit allocation. Williams (2025) shows that foreign bank presence reduces formal credit access in emerging economies unless supported by robust information-sharing infrastructures. Using panel data from 21 countries in the MENA region (2000–2021), Azmeh (2025) find that foreign bank entry reduces financial access but boosts financial usage, with institutional quality significantly moderating these effects. Open Banking addresses these challenges by enabling alternative data use for credit scoring, reducing reliance on traditional metrics (Sadok et al., 2022). Kowalewski & Pisany (2022) notes that fintech and bigtech credit providers compete with banks in emerging markets, but their impact on operational credit access for SMEs is mixed.
2.4 Labor Productivity and Economic Performance
Labor productivity, a critical driver of economic growth, is influenced by access to finance, technological advancements, and institutional factors (Fang & Zhu, 2023; X. Liu & Zhao, 2024). Peprah et al. (2021) demonstrates that financial inclusion significantly boosts agricultural productivity in Ghana. Nguyen et al. (2023) further supports this, showing that internet use and female leadership in Vietnamese agricultural cooperatives significantly improve labor productivity. Türüç & k-Erbilen (2025) emphasizes that both renewable energy and education significantly boost labor productivity in Sub-Saharan Africa by facilitating technological diffusion. Prívara et al. (2025) shows that digitization enhances capital productivity in EU25 countries, but digital infrastructure alone is insufficient without complementary digital skills. However, few studies directly link Open Banking to labor productivity, despite its potential to streamline credit access and resource allocation (Johri et al., 2024).
2.5 Gender and Socioeconomic Dimensions
Gender and socioeconomic factors significantly influence financial inclusion and credit access (Asongu et al., 2024). Perrin & Weill (2022) finds that reducing gender gaps in credit access enhances financial stability. Parameswaran & Kadam (2025) reveals that technology adoption helps close the gender gap in access to formal credit for women-owned enterprises in India. Mahato & Kanth (2025) finds that digital financial inclusion positively impacts family firm performance in India, particularly for women entrepreneurs. These findings suggest that Open Banking’s data-driven approach could mitigate biases in credit allocation, but its effectiveness depends on addressing socioeconomic disparities (Shihadeh, 2018).
2.6 Literature Gaps
The literature reveals several critical gaps. First, Open Banking’s interaction with firm-level financial inclusion, particularly for SMEs in diverse economic contexts, remains underexplored (Niankara et al., 2025). Second, studies on labor productivity rarely integrate financial innovations like Open Banking (X. Liu & Zhao, 2024). Third, the heterogeneous effects of financial inclusion and Open Banking across socioeconomic groups—particularly gender and firm size—require further analysis (Tanchangya et al., 2025). These gaps highlight the need for a comprehensive analysis of how Open Banking maturity interacts with financial inclusion to influence credit access and labor productivity, particularly for underserved groups in emerging markets.
3. Theoretical Framework and Testable Hypotheses
3.1 Firm Production and Productivity
To address how national Open Banking (OB) maturity and firm-level financial inclusion interact to affect firm operational performance, we model each firm’s production using a Cobb–Douglas function. For firm i in country c, output Y_{ic} is:
Y_{ic} = A_{ic} \cdot K_{ic}^{\alpha} \cdot L_{ic}^{1-\alpha}
where Y_{ic} is output (proxied by firm sales), K_{ic} and L_{ic} are capital and labor inputs, A_{ic} is Total Factor Productivity (TFP) capturing institutional and technological efficiency, and \alpha is the output elasticity of capital.
3.2 TFP as a Function of Policy and Inclusion
TFP is endogenously influenced by OB_c (Open Banking maturity in country c), AccOwn_{ic} (checking/savings account ownership), and their interaction OB_c \times AccOwn_{ic}:
\log(A_{ic}) = \gamma_0 + \gamma_1 OB_c + \gamma_2 AccOwn_{ic} + \gamma_3 (OB_c \times AccOwn_{ic}) + \mathbf{Z}_{ic}'\delta + \varepsilon_{ic}
where \mathbf{Z}_{ic} represents firm-level control variables (size, sector, external audit, digital strategy) and \varepsilon_{ic} is the error term.
3.3 Credit Access as Binary Outcomes
We define two binary credit access outcomes: OD_{ic} \in \{0,1\} (overdraft facility access) and Loan_{ic} \in \{0,1\} (credit line or loan access). Each is modeled using a probit specification:
Equation 1 — Overdraft Facility Access:
\Pr(OD_{ic} = 1) = \Phi\!\left( \beta_0 + \beta_1 OB_c + \beta_2 AccOwn_{ic} + \beta_3 (OB_c \times AccOwn_{ic}) + \mathbf{Z}_{ic}'\theta + \nu^{(1)}_{ic} \right)
Equation 2 — Credit Line or Loan Access:
\Pr(Loan_{ic} = 1) = \Phi\!\left( \lambda_0 + \lambda_1 OB_c + \lambda_2 AccOwn_{ic} + \lambda_3 (OB_c \times AccOwn_{ic}) + \mathbf{Z}_{ic}'\eta + \nu^{(2)}_{ic} \right)
where \Phi(\cdot) denotes the standard normal CDF.
3.4 Labor Productivity as Operational Performance
Labor productivity is defined as:
LP_{ic} = \frac{Y_{ic}}{L_{ic}} \quad \Rightarrow \quad \log(LP_{ic}) = \log(Y_{ic}) - \log(L_{ic})
Substituting the Cobb–Douglas specification and the structural TFP equation yields the estimable labor productivity model:
\log\!\left( \frac{Sales_{ic}}{LaborCost_{ic}} \right) = \gamma_0 + \gamma_1 OB_c + \gamma_2 AccOwn_{ic} + \gamma_3 (OB_c \times AccOwn_{ic}) + \mathbf{Z}_{ic}'\delta + \varepsilon_{ic}
3.5 Testable Hypotheses
Based on the proposed theoretical framework, we derive the following testable hypotheses:
Table 1: Summary of Testable Hypotheses
| Hypothesis | Focus Area | Expected Sign |
|---|---|---|
| H1a | OB Maturity → Overdraft Access | \beta_1 > 0 |
| H1b | Account Ownership → Overdraft Access | \beta_2 > 0 |
| H1c | OB × Account → Overdraft Access | \beta_3 > 0 |
| H2a | OB Maturity → Loan Access | \lambda_1 > 0 |
| H2b | Account Ownership → Loan Access | \lambda_2 > 0 |
| H2c | OB × Account → Loan Access | \lambda_3 > 0 |
| H3a | OB Maturity → Labor Productivity | \gamma_1 > 0 |
| H3b | Account Ownership → Labor Productivity | \gamma_2 > 0 |
| H3c | OB × Account → Labor Productivity | \gamma_3 > 0 |
4. Econometric Modeling Strategy
4.1 Copula-Based Joint Estimation Framework
To empirically assess how national Open Banking maturity and firm-level account ownership jointly affect access to credit services and labor productivity, we estimate a system of bivariate mixed models using the Generalised Joint Regression Modelling (GJRM) framework in R (Wojtys et al., 2018). This approach allows for the correlation of unobservables between the discrete and continuous outcomes, improving efficiency and capturing latent dependencies.
4.2 Model Specification
The outcome equations are defined as:
- Equation 1 (Credit Service Access): Binary outcome for either overdraft facility access or line of credit/loan access.
- Equation 2 (Operational Performance): Continuous outcome: LaborProductivity_{ic} = \log(Sales_{ic} / LaborCost_{ic})
The regression equations with interaction terms between Open Banking maturity (OBapp) and account ownership (ChecAndORSavAccOwnshp) are:
f_1: \texttt{OverDraftFacility} \sim OBapp \times ChecAndORSavAccOwnshp + \text{Controls}
f_2: \texttt{LineCredORLoanFinInst} \sim OBapp \times ChecAndORSavAccOwnshp + \text{Controls}
f_3: \texttt{LaborProdctvty} \sim OBapp \times ChecAndORSavAccOwnshp + \text{Controls}
Firm-level controls include: iCert, DigitStratg2, extAudit, AccsToFinObstOP, nyearsOper, legalStat, size, sector_MS, region, largFirm, femOwner, MangYrExpSect, PercSenManTimGovReg, PraCompInfSec, TaxRates, TranspObstOP, PolInstab, PolCorupt, year. Smooth terms s(variable) capture nonlinear effects; random effects for region and year use bs = "re".
4.3 Joint Estimation via GJRM
The equations are jointly estimated using the gjrm() function from the GJRM package. Four combinations are estimated: (1) Overdraft (probit) + Labor Productivity (Gaussian); (2) Credit Line/Loan (probit) + Labor Productivity (Gaussian); (3) Overdraft (logit) + Labor Productivity; (4) Credit Line/Loan (logit) + Labor Productivity. Robustness checks use Gumbel and Clayton copulas.
4.4 The Data Source
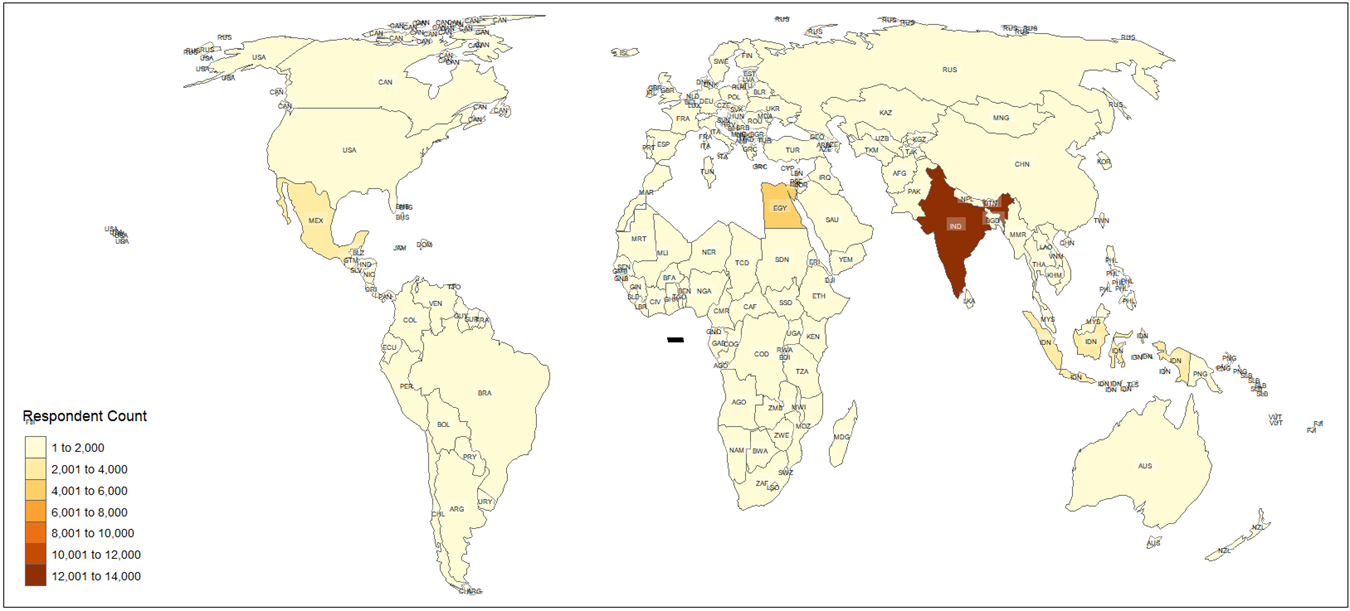
This study adopts a cross-sectional panel design, leveraging secondary data from the World Bank Enterprise Survey (WBES) database, updated as of April 14, 2025 (World Bank Enterprise Survey, 2025). The WBES employs a standardized core questionnaire and stratified random sampling (stratified by firm size, sector, and region), ensuring comparability across countries and over time. Figure 1 maps the cross-national coverage of the data sample (148 countries).
5. Results
5.1 Descriptive Statistics — Qualitative Variables
The qualitative descriptive statistics reveal a sample dominated by small (49.33%) and independent (83.74%) firms, with strong basic financial inclusion (87.62% with checking/savings accounts) but limited access to advanced financial services: only 39.50% have overdraft facilities and 23.53% have credit lines/loans. The significant presence of firms in live Open Banking environments (36.79%) highlights growing financial innovation. Operational challenges—including informal sector competition, tax rates, political instability, and corruption—affect 60–62% of firms to varying degrees. Figure 2 and Figure 3 show the global distribution of overdraft and credit line access.
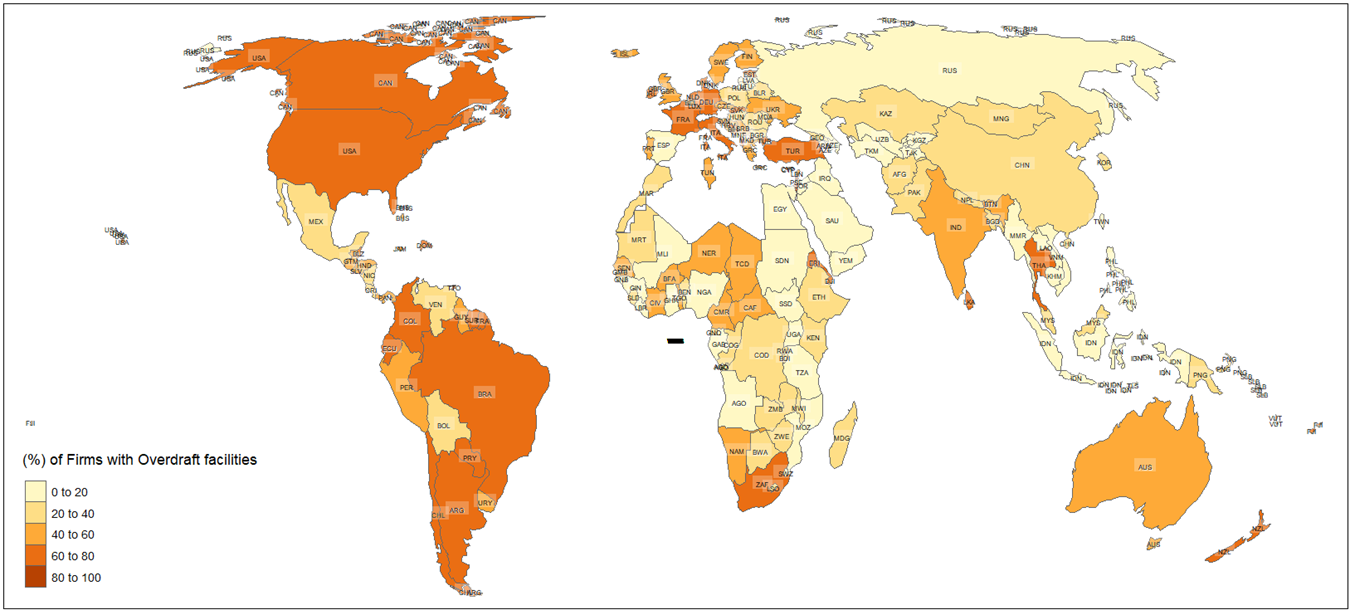
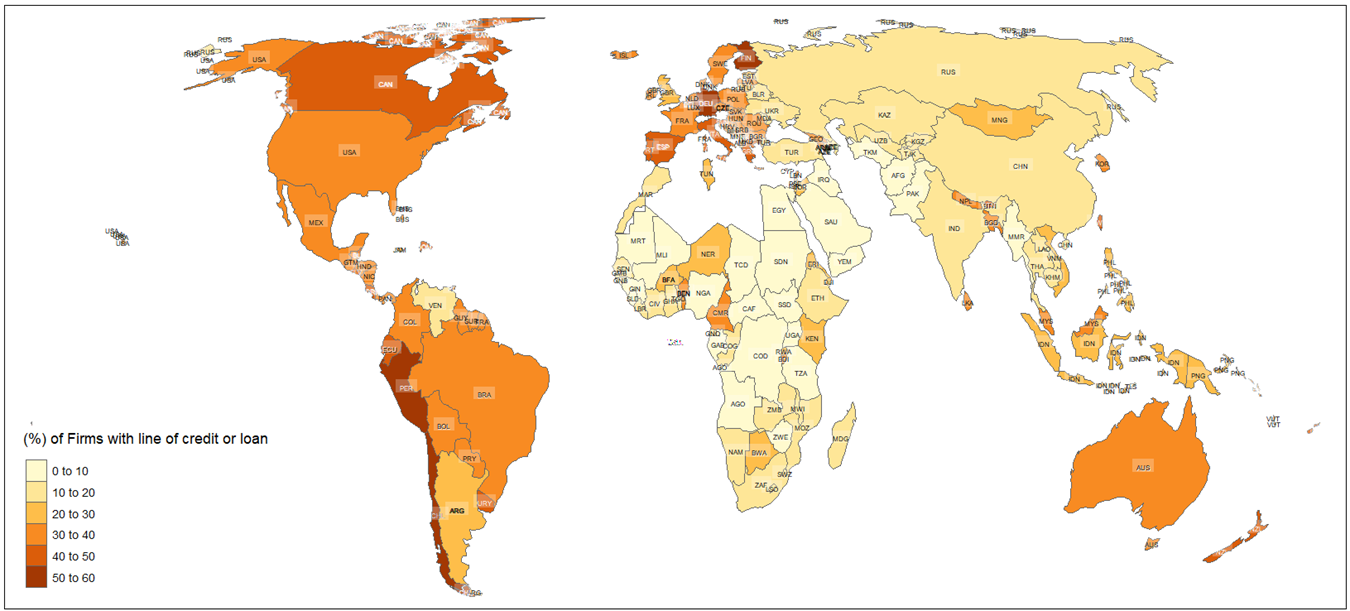
Table 2: Summary Statistics of Qualitative Variables
| Variable | Category | Frequency | Percent (%) |
|---|---|---|---|
| Overdraft Facility | No | 68,406 | 60.50 |
| Yes | 44,683 | 39.50 | |
| Line of Credit or Loan | No | 86,481 | 76.47 |
| Yes | 26,608 | 23.53 | |
| Open Banking Status | No Official Initiative | 35,267 | 31.19 |
| In Development | 36,207 | 32.02 | |
| Live | 41,615 | 36.79 | |
| Checking/Savings Account | No | 13,995 | 12.38 |
| Yes | 99,094 | 87.62 | |
| International Certification | No | 86,261 | 76.27 |
| Yes | 26,828 | 23.73 | |
| Digital Strategy | None | 38,555 | 33.48 |
| Website Only | 37,861 | 32.88 | |
| Email Only | 15,147 | 13.15 | |
| Website and Email | 21,526 | 18.70 | |
| External Audit | No | 56,550 | 50.00 |
| Yes | 56,539 | 50.00 | |
| Legal Status | Shareholding (Publicly Traded) | 4,550 | 4.02 |
| Shareholding (Non-/Privately Traded) | 42,666 | 37.73 | |
| Sole Proprietorship | 41,702 | 36.88 | |
| Partnership | 10,981 | 9.71 | |
| Limited Partnership | 11,812 | 10.45 | |
| Other | 1,378 | 1.22 | |
| Firm Size | Small | 55,781 | 49.33 |
| Medium | 37,476 | 33.15 | |
| Large | 19,832 | 17.54 | |
| Sector | Manufacturing | 57,474 | 50.84 |
| Services | 55,615 | 49.16 | |
| Region | North America | 2,565 | 2.27 |
| Africa | 24,208 | 21.41 | |
| East Asia & Pacific | 12,775 | 11.30 | |
| Europe & Central Asia | 30,780 | 27.22 | |
| Latin America & Caribbean | 13,793 | 12.20 | |
| Middle East & North Africa | 10,146 | 8.97 | |
| South Asia | 18,822 | 16.64 | |
| Part of Large Firm | No | 94,708 | 83.74 |
| Yes | 18,381 | 16.26 | |
| Female Ownership | No | 79,189 | 70.03 |
| Yes | 33,900 | 29.97 |
Table 3: Summary Statistics of Qualitative Variables — Operational Obstacles (Cont.)
| Variable | Category | Frequency | Percent (%) |
|---|---|---|---|
| Informal Sector Competition | No Obstacle | 43,037 | 38.06 |
| Minor | 22,668 | 20.04 | |
| Moderate | 22,469 | 19.87 | |
| Major | 16,056 | 14.20 | |
| Severe | 8,859 | 7.84 | |
| Tax Rates | No Obstacle | 30,539 | 27.01 |
| Minor | 22,583 | 19.97 | |
| Moderate | 27,509 | 24.33 | |
| Major | 21,594 | 19.10 | |
| Severe | 10,864 | 9.61 | |
| Transport | No Obstacle | 47,574 | 42.07 |
| Minor | 26,004 | 23.00 | |
| Moderate | 20,835 | 18.42 | |
| Major | 12,788 | 11.31 | |
| Severe | 5,884 | 5.20 | |
| Political Instability | No Obstacle | 42,774 | 37.82 |
| Minor | 19,860 | 17.57 | |
| Moderate | 19,440 | 17.19 | |
| Major | 17,777 | 15.72 | |
| Severe | 13,238 | 11.71 | |
| Political Corruption | No Obstacle | 44,286 | 39.16 |
| Minor | 19,711 | 17.43 | |
| Moderate | 18,329 | 16.21 | |
| Major | 17,502 | 15.48 | |
| Severe | 13,261 | 11.73 |
5.2 Descriptive Statistics — Quantitative Variables
Figure 4 displays the national-level mean and standard deviation of firm labor productivity across the 148 countries in the sample.
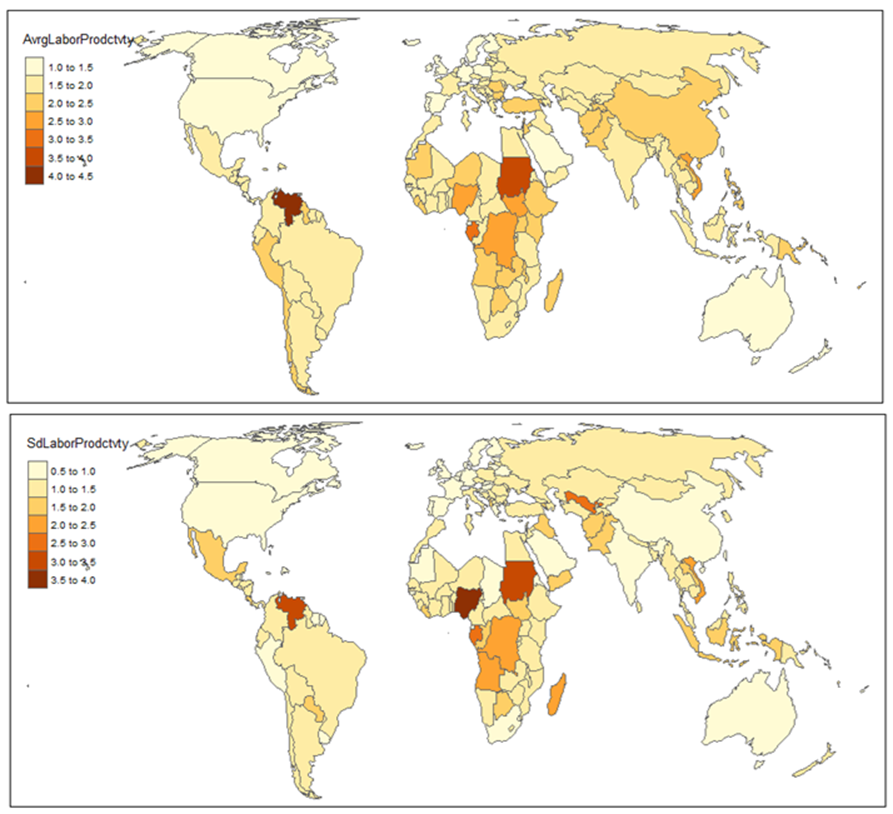
Table 4: Summary Statistics of Quantitative Variables
| Variable | Min | 1st Qu. | Median | Mean | 3rd Qu. | Max |
|---|---|---|---|---|---|---|
| Labor Productivity | -20.107 | 1.099 | 1.684 | 1.901 | 2.450 | 23.537 |
| Access to Finance Obstacle | 0.000 | 0.000 | 1.000 | 1.316 | 2.000 | 4.000 |
| Years of Operation | 0.000 | 9.000 | 16.000 | 20.150 | 26.000 | 225.000 |
| Manager’s Sector Experience (Yrs) | 1.000 | 10.000 | 16.000 | 18.630 | 25.000 | 75.000 |
| % Senior Management Time (Gov. Reg.) | 0.000 | 0.000 | 2.000 | 9.935 | 10.000 | 100.000 |
| Total Annual Sales (Million USD) | 0 | 2 | 14 | 22,372 | 120 | 500,000,000 |
| Total Labor Cost (Million USD) | 0 | 0 | 2 | 1,918,000 | 15 | 199,800,000,000 |
| Weight in Regional Strata | 0.000 | 0.000 | 0.000 | 0.002 | 0.002 | 0.072 |
Labor productivity ranges from −20.107 to 23.537, with a median of 1.684 and mean of 1.901, indicating a slightly right-skewed distribution. Access to finance is a minor-to-moderate obstacle for most firms (median = 1.000, mean = 1.316), but the third quartile of 2.000 indicates that a significant portion face moderate-to-severe constraints. Firms typically have 16 years of operation (median) and managers average 18.6 years of sector experience. Sales and labor costs are highly right-skewed, with most firms operating at modest SME-level scales while a few large firms drive high means.
5.3 Sensitivity Analysis — Margin and Copula Specifications
Table 5: Comparative Analysis of Margin and Copula Specifications
| Model | Specification | df | AIC | BIC |
|---|---|---|---|---|
| Model 13: Margin Comparison | ||||
| Probit Margin | Gaussian Copula | 133.8 | 506,271 | 507,560 |
| Logit Margin | Gaussian Copula | 133.8 | 506,236 | 507,526 |
| Model 13: Copula Comparison (Logit) | ||||
| Logit Margin | Gaussian Copula | 133.8 | 506,236 | 507,526 |
| Logit Margin | Gumbel Copula | 133.8 | 506,322 | 507,612 |
| Logit Margin | Clayton Copula | 133.8 | 506,296 | 507,585 |
| Model 23: Margin Comparison | ||||
| Probit Margin | Gaussian Copula | 135.1 | 485,328 | 486,630 |
| Logit Margin | Gaussian Copula | 135.1 | 485,328 | 486,630 |
| Model 23: Copula Comparison (Logit) | ||||
| Logit Margin | Gaussian Copula | 135.1 | 485,328 | 486,630 |
| Logit Margin | Gumbel Copula | 135.1 | 485,403 | 486,705 |
| Logit Margin | Clayton Copula | 135.1 | 485,354 | 486,656 |
The Logit margin with a Gaussian copula is the best-performing specification for Model 13 (AIC: 506,236 vs. 506,271 for Probit). For Model 23, Probit and Logit margins perform identically (AIC: 485,328), while the Gaussian copula consistently outperforms Gumbel and Clayton copulas across both models, confirming symmetric dependence between credit access and labor productivity.
5.4 Econometric Results — Model 13 (Overdraft × Labor Productivity)
Table 6: Estimated Logit-Gaussian Copula Model Results (copula_model_log13)
| Term | Estimate | Std. Error | z value | p-value |
|---|---|---|---|---|
| Equation 1: Overdraft Facility (Logit Link) | ||||
| (Intercept) | -2.5471 | 0.2233 | -11.407 | <2e-16 *** |
| OBapp: In Development | -0.4230 | 0.0806 | -5.248 | 1.54e-07 *** |
| OBapp: Live | 0.3278 | 0.0639 | 5.132 | 2.87e-07 *** |
| Checking/Savings Account | 1.3087 | 0.0495 | 26.428 | <2e-16 *** |
| International Certification | 0.2750 | 0.0171 | 16.107 | <2e-16 *** |
| Digital Strategy: Website Only | 0.3679 | 0.0202 | 18.208 | <2e-16 *** |
| Digital Strategy: Email Only | 0.6501 | 0.0279 | 23.316 | <2e-16 *** |
| Digital Strategy: Website and Email | 0.8906 | 0.0277 | 32.173 | <2e-16 *** |
| External Audit | 0.3156 | 0.0145 | 21.801 | <2e-16 *** |
| Access to Finance Obstacle | -0.0188 | 0.0061 | -3.077 | 0.002 ** |
| Legal Status: Non-/Privately Traded | 0.0785 | 0.0343 | 2.285 | 0.022 * |
| Legal Status: Sole Proprietorship | -0.1385 | 0.0362 | -3.825 | <0.001 *** |
| Legal Status: Partnership | 0.0312 | 0.0396 | 0.788 | 0.430 |
| Legal Status: Limited Partnership | 0.0453 | 0.0387 | 1.170 | 0.242 |
| Legal Status: Other | 0.1470 | 0.0669 | 2.198 | 0.028 * |
| Size: Medium | 0.2131 | 0.0158 | 13.444 | <2e-16 *** |
| Size: Large | 0.4041 | 0.0211 | 19.195 | <2e-16 *** |
| Sector: Services | 0.0242 | 0.0144 | 1.680 | 0.093 . |
| Part of Large Firm | 0.1389 | 0.0185 | 7.503 | 6.24e-14 *** |
| Female Ownership | -0.0964 | 0.0154 | -6.280 | 3.38e-10 *** |
| Informal Sector Competition | 0.0155 | 0.0057 | 2.711 | 0.007 ** |
| Tax Rates | -0.0025 | 0.0061 | -0.412 | 0.680 |
| Transport Obstacle | 0.0348 | 0.0061 | 5.702 | 1.18e-08 *** |
| Political Instability | -0.0024 | 0.0061 | -0.396 | 0.692 |
| Political Corruption | 0.0329 | 0.0062 | 5.285 | 1.26e-07 *** |
| OBapp: In Development × Checking/Savings | 0.3356 | 0.0818 | 4.104 | 4.05e-05 *** |
| OBapp: Live × Checking/Savings | -0.0922 | 0.0646 | -1.426 | 0.154 |
| Smooth Terms | edf | Ref.df | Chi.sq | p-value |
| s(Years of Operation) | 6.294 | 7.111 | 141.12 | <2e-16 *** |
| s(Region) | 5.980 | 6.000 | 1,663.50 | <2e-16 *** |
| s(Manager’s Sector Experience) | 2.433 | 3.088 | 171.08 | <2e-16 *** |
| s(% Senior Management Time) | 6.608 | 7.587 | 47.88 | <2e-16 *** |
| s(Year) | 18.727 | 19.000 | 1,117.39 | <2e-16 *** |
| Equation 2: Labor Productivity (Identity Link) | ||||
| (Intercept) | 1.6257 | 0.1062 | 15.304 | <2e-16 *** |
| OBapp: In Development | -0.0110 | 0.0264 | -0.416 | 0.677 |
| OBapp: Live | 0.0597 | 0.0270 | 2.206 | 0.027 * |
| Checking/Savings Account | 0.1071 | 0.0187 | 5.714 | 1.11e-08 *** |
| International Certification | 0.1886 | 0.0100 | 18.812 | <2e-16 *** |
| Digital Strategy: Website Only | 0.0574 | 0.0114 | 5.049 | 4.44e-07 *** |
| Digital Strategy: Email Only | 0.0818 | 0.0147 | 5.573 | 2.50e-08 *** |
| Digital Strategy: Website and Email | 0.0833 | 0.0147 | 5.665 | 1.47e-08 *** |
| External Audit | 0.0384 | 0.0082 | 4.653 | 3.26e-06 *** |
| Access to Finance Obstacle | -0.0485 | 0.0034 | -14.347 | <2e-16 *** |
| Legal Status: Sole Proprietorship | -0.0789 | 0.0208 | -3.790 | <0.001 *** |
| Size: Medium | 0.0329 | 0.0090 | 3.644 | <0.001 *** |
| Size: Large | 0.0619 | 0.0122 | 5.069 | 3.99e-07 *** |
| Sector: Services | 0.0611 | 0.0080 | 7.604 | 2.88e-14 *** |
| Part of Large Firm | 0.1201 | 0.0106 | 11.323 | <2e-16 *** |
| Female Ownership | -0.0474 | 0.0086 | -5.506 | 3.67e-08 *** |
| Tax Rates | -0.0072 | 0.0034 | -2.124 | 0.034 * |
| Transport Obstacle | 0.0544 | 0.0034 | 15.861 | <2e-16 *** |
| Political Instability | 0.0226 | 0.0034 | 6.647 | 3.00e-11 *** |
| OBapp: In Development × Checking/Savings | -0.0231 | 0.0278 | -0.831 | 0.406 |
| OBapp: Live × Checking/Savings | -0.2265 | 0.0279 | -8.121 | 4.63e-16 *** |
| Smooth Terms | edf | Ref.df | Chi.sq | p-value |
| s(Years of Operation) | 3.968 | 4.792 | 36.47 | 1.03e-06 *** |
| s(Region) | 5.966 | 7.000 | 1,020.15 | <2e-16 *** |
| s(Manager’s Sector Experience) | 4.331 | 5.278 | 91.06 | <2e-16 *** |
| s(% Senior Management Time) | 4.722 | 5.674 | 25.71 | <0.001 *** |
| s(Year) | 18.812 | 20.000 | 1,035.69 | <2e-16 *** |
| Model Summary | ||||
| σ² = 1.25 (95% CI: 1.25, 1.26) | ||||
| θ = 0.0486 (95% CI: 0.0403, 0.0569) | ||||
| n = 113,089; Total edf = 134 |
Significance codes: ** p < 0.001, ** p < 0.01, * p < 0.05, . p < 0.1*
Key findings from Model 13: Live Open Banking significantly increases overdraft access (coefficient = 0.3278, p < 2e{-16}), while “In Development” status reduces it (−0.4230, p = 1.54e{-7}). Checking/savings account ownership strongly boosts overdraft odds (1.3087, p < 2e{-16}). Combined digital strategy (website and email) has the largest positive effect on overdraft access (0.8906). For labor productivity, live Open Banking yields a modest positive effect (0.0597, p = 0.027), but the interaction between live Open Banking and account ownership significantly reduces productivity (−0.2265, p = 4.63e{-16}), indicating implementation complexities. The weak positive copula dependence (\theta = 0.0486) between overdraft access and productivity confirms a mild but significant interdependence.
5.5 Econometric Results — Model 23 (Credit Line/Loan × Labor Productivity)
Table 7: Estimated Logit-Gaussian Copula Model Results (copula_model_log23)
| Term | Estimate | Std. Error | z value | p-value |
|---|---|---|---|---|
| Equation 1: Line of Credit or Loan (Probit Link) | ||||
| (Intercept) | -1.7944 | 0.1238 | -14.492 | <2e-16 *** |
| OBapp: In Development | 0.0945 | 0.0403 | 2.343 | 0.019 * |
| OBapp: Live | 0.2665 | 0.0389 | 6.856 | 7.09e-12 *** |
| Checking/Savings Account | 0.4870 | 0.0292 | 16.687 | <2e-16 *** |
| International Certification | 0.0546 | 0.0111 | 4.933 | 8.10e-07 *** |
| Digital Strategy: Website Only | 0.2093 | 0.0136 | 15.377 | <2e-16 *** |
| Digital Strategy: Email Only | 0.2601 | 0.0180 | 14.480 | <2e-16 *** |
| Digital Strategy: Website and Email | 0.2765 | 0.0178 | 15.526 | <2e-16 *** |
| External Audit | 0.1771 | 0.0095 | 18.550 | <2e-16 *** |
| Access to Finance Obstacle | 0.1211 | 0.0039 | 30.960 | <2e-16 *** |
| Legal Status: Non-/Privately Traded | 0.0509 | 0.0223 | 2.289 | 0.022 * |
| Legal Status: Sole Proprietorship | -0.0280 | 0.0237 | -1.183 | 0.237 |
| Legal Status: Limited Partnership | 0.0863 | 0.0250 | 3.447 | 0.001 *** |
| Size: Medium | 0.1567 | 0.0104 | 15.095 | <2e-16 *** |
| Size: Large | 0.2210 | 0.0137 | 16.139 | <2e-16 *** |
| Sector: Services | -0.0470 | 0.0094 | -5.025 | 5.04e-07 *** |
| Female Ownership | 0.0873 | 0.0096 | 9.081 | <2e-16 *** |
| Informal Sector Competition | 0.0094 | 0.0037 | 2.545 | 0.011 * |
| Transport Obstacle | 0.0098 | 0.0039 | 2.495 | 0.013 * |
| Political Instability | -0.0131 | 0.0039 | -3.333 | 0.001 *** |
| Political Corruption | -0.0146 | 0.0040 | -3.616 | <0.001 *** |
| OBapp: In Development × Checking/Savings | -0.1493 | 0.0415 | -3.599 | <0.001 *** |
| OBapp: Live × Checking/Savings | -0.1109 | 0.0396 | -2.797 | 0.005 ** |
| Smooth Terms | edf | Ref.df | Chi.sq | p-value |
| s(Years of Operation) | 1.000 | 1.000 | 9.28 | 0.002 ** |
| s(Region) | 5.965 | 7.000 | 1,540.88 | <2e-16 *** |
| s(Manager’s Sector Experience) | 7.190 | 7.853 | 115.90 | <2e-16 *** |
| s(% Senior Management Time) | 8.333 | 8.843 | 227.93 | <2e-16 *** |
| s(Year) | 18.816 | 20.000 | 1,999.75 | <2e-16 *** |
| Equation 2: Labor Productivity — same coefficients as Model 13 | ||||
| OBapp: Live | 0.0598 | 0.0271 | 2.209 | 0.027 * |
| Checking/Savings Account | 0.1070 | 0.0187 | 5.712 | 1.12e-08 *** |
| OBapp: Live × Checking/Savings | -0.2267 | 0.0279 | -8.126 | 4.43e-16 *** |
| Model Summary | ||||
| σ² = 1.25 (95% CI: 1.25, 1.26) | ||||
| θ = 0.0447 (95% CI: 0.0368, 0.0533) | ||||
| n = 113,089; Total edf = 135 |
Significance codes: ** p < 0.001, ** p < 0.01, * p < 0.05*
Key findings from Model 23: Unlike the overdraft model, both Open Banking stages positively affect loan/credit line access (In Development: 0.0945, p = 0.019; Live: 0.2665, p = 7.09e{-12}). Notably, access-to-finance obstacles increase credit line access (0.1211, p < 2e{-16}), suggesting that constrained firms actively seek credit. Female ownership positively affects credit line access (0.0873, p < 2e{-16}), contrasting with the gender penalty observed in overdraft access. Both interaction terms between Open Banking and account ownership are negative (H2c rejected), suggesting diminishing returns in mature and transitional Open Banking systems.
6. Discussion and Implications
6.1 Implications for the Guiding Hypotheses
The results offer nuanced support for the proposed hypotheses. For overdraft access (H1a–H1c): H1a is partially supported—live Open Banking increases overdraft access (+0.3278) but “In Development” reduces it (−0.4230), implying that benefits are contingent on full implementation and that partial reforms may exacerbate exclusion. H1b is strongly confirmed (account ownership: +1.3087). H1c is rejected for live systems (interaction insignificant), but shows a positive effect for “In Development” (+0.3356), suggesting synergies peak during transition phases.
For loan/credit line access (H2a–H2c): H2a is fully supported with positive effects at both stages. H2b is robustly confirmed. H2c is rejected with negative interactions for both stages (\lambda_3 < 0), highlighting diminishing returns where advanced data analytics may bypass traditional account-based assessments (Broby, 2021).
For labor productivity (H3a–H3c): H3a receives partial support—live Open Banking modestly improves productivity (+0.0597–0.0598). H3b is strongly upheld (+0.1070–0.1071). H3c is contradicted with negative live interactions (−0.2265 to −0.2267), suggesting potential inefficiencies or over-leveraging in mature Open Banking systems (Prívara et al., 2025).
6.2 Practical Implications
The high prevalence of checking/savings accounts (87.62%) underscores the importance of formal banking relationships for credit access and productivity (Charfeddine & Zaouali, 2022). Digital strategies (18.70% use both website and email) and certifications (23.73%) significantly enhance creditworthiness. Firms in live Open Banking environments (36.79%) should leverage API-driven services for real-time credit assessments (Farrow, 2020), but negative interactions highlight challenges such as data privacy concerns or integration costs (Grassi et al., 2022). The persistent credit access gap (60.50% lack overdrafts; 76.47% lack credit lines) suggests SMEs could benefit from fintech partnerships or affiliations with larger entities to enhance credibility.
6.3 Policy Implications
Policymakers should prioritize Open Banking frameworks to enhance financial inclusion, particularly in developing economies (32.02% “In Development”; 31.19% “No Initiative”). The positive effect of live Open Banking on credit access supports regulatory investments in secure data-sharing ecosystems (Biehl, 2023). The unexpected positive effect of access-to-finance obstacles on credit line access suggests firms in constrained environments actively seek credit, warranting targeted interventions like credit guarantees (Preziuso et al., 2023b). Gender disparities in overdraft access but positive credit line effects suggest Open Banking’s transparent scoring can address biases (Kokkinis & Miglionico, 2020). Addressing operational challenges (61.94% report informal sector competition; 62.18% political instability) necessitates broader reforms to reduce corruption and improve governance (Aytaş et al., 2021). Vo (2025) emphasize that institutional quality, particularly in high-income countries, significantly enhances financial inclusion, underscoring the need for robust institutional reforms alongside fintech adoption.
6.4 Sustainable Development Implications
The findings align with SDGs 8 (Decent Work and Economic Growth), 9 (Industry, Innovation, and Infrastructure), 5 (Gender Equality), and 16 (Peace, Justice, and Strong Institutions). Open Banking and financial inclusion promote SME growth (49.33% small firms), fostering job creation and economic resilience (Tanchangya et al., 2025). Digital strategies support SDG 9 by enhancing market access and innovation. Addressing gender disparities via transparent credit scoring supports SDG 5 (Bianco & Vangelisti, 2022; Parameswaran & Kadam, 2025). High operational obstacles (52.04% report tax rate issues) highlight the need for integrated reforms to support SDG 16 (Zeller & Lynch, 2020). Broby (2021) argues that trust and liquidity transformation remain central to banking’s future, suggesting that Open Banking innovations must be paired with strong institutional frameworks to achieve sustainable development.
7. Conclusion and Future Research
This study confirms that Open Banking and financial inclusion significantly enhance SME credit access and productivity, with live Open Banking systems and access to formal financial services serving as key drivers (Ha et al., 2025; Z. Liu et al., 2024). The findings extend institutional economics and production theory by demonstrating how secure, API-driven data-sharing ecosystems and inclusive FinTech innovations improve lending rates and market access, particularly in developing economies (Nazaritehrani & Mashali, 2020; Preziuso et al., 2023b). However, negative interaction effects (H1c, H2c, H3c) reveal context-specific implementation challenges—regulatory barriers, trust issues, and varying institutional quality—necessitating nuanced policy approaches (Grassi et al., 2022; Vo, 2025).
Limitations include potential selection bias in World Bank Enterprise Surveys, with underrepresentation in North America (2.27%) (World Bank, 2022), and the weak copula dependence (\theta = 0.0486; 0.0447) suggesting unmodeled factors such as consumer trust or fintech adoption rates (Chan et al., 2022; Iman et al., 2023). Future research should explore longitudinal effects of Open Banking, industry-specific dynamics, qualitative studies of adaptive strategies in constrained environments, and the role of emerging technologies (blockchain, AI) in enhancing Open Banking’s scalability. Alternative copulas (e.g., t-copulas) could model asymmetric dependencies in financial inclusion data (Wojtys et al., 2018).
Policymakers are urged to foster secure, interoperable Open Banking ecosystems and robust institutional reforms to maximize global impact, particularly in underserved regions (Ha et al., 2025; Vo, 2025).
Declarations
Funding: Not applicable.
Conflict of interest: The author declares no competing interests.
Ethics approval and consent to participate: Not applicable.
Data availability: The data used in this research is available upon reasonable request.
Code availability: R code is available upon reasonable request.
CRediT authorship contribution statement: Conceptualization, methodology, analysis, writing.
References
Asongu, S. A., Agyemang-Mintah, P., Nnanna, J., & Ngoungou, Y. E. (2024). Mobile money innovations, income inequality and gender inclusion in sub-saharan africa. Financial Innovation, 10(1), 11.
Aytaş, B., Öztaner, S. M., & Şener, E. (2021). Open banking: Opening up the “walled gardens.” Journal of Payments Strategy & Systems, 15(4), 419–431.
Azmeh, C. (2025). Foreign banks entry and financial inclusion: Insights from MENA region. International Journal of Islamic and Middle Eastern Finance and Management.
Bianco, M., & Vangelisti, M. I. (2022). Open banking and financial inclusion 54. European Economy, (1), 81–97. https://www.proquest.com/openview/425834d5c75a9aff6cbc940cf9fb46b1/1?pq-origsite=gscholar&cbl=2045916
Biehl, M. (2023). Open banking map. https://www.openbankingmap.com/.
Borgogno, O., & Manganelli, A. (2021). Financial technology and regulation: The competitive impact of open banking. Market and Competition Law Review, 5, 105.
Brixiová, Z., Kangoye, T., & Yogo, T. U. (2020). Access to finance among small and medium-sized enterprises and job creation in africa. Structural Change and Economic Dynamics, 55, 177–189. https://doi.org/10.1016/j.strueco.2020.08.008
Broby, D. (2021). Financial technology and the future of banking. Financial Innovation, 7(1), 47.
Casolaro, A. M. B., Rauber, G. N., & Lima, U. S. M. de. (2024). Open banking: A systematic literature review. Journal of Banking Regulation, 1–16.
Chan, R., Troshani, I., Rao Hill, S., & Hoffmann, A. (2022). Towards an understanding of consumers’ FinTech adoption: The case of open banking. International Journal of Bank Marketing, 40(4), 886–917. https://doi.org/10.1108/IJBM-10-2021-0487
Charfeddine, L., & Zaouali, S. (2022). The effects of financial inclusion and the business environment in spurring the creation of early-stage firms and supporting established firms. Journal of Business Research, 143, 1–15.
Demirguc-Kunt, A., Klapper, L., Singer, D., Ansar, S., & Hess, J. (2018). The global findex database 2017: Measuring financial inclusion and the fintech revolution. World Bank Publications.
Dinckol, D., Ozcan, P., & Zachariadis, M. (2023). Regulatory standards and consequences for industry architecture: The case of UK open banking. Research Policy, 52(6), 104760. https://doi.org/10.1016/j.respol.2023.104760
Fang, J., & Zhu, J. (2023). The impact of open banking on traditional lending in the BRICS. Finance Research Letters, 58, 104300. https://doi.org/10.1016/j.frl.2023.104300
Farrow, G. S. (2020). An application programming interface model for open banking ecosystems. Journal of Payments Strategy & Systems, 14(1), 75–91.
Gillani, S. A., Alvi, A. R., Ahmad, H., Gillani, S. A., & Tanveer, Y. (2025). FinTech adoption for SMEs: Innovation and opportunities worldwide. In Algorithmic training, future markets, and big data for finance digitalization (pp. 105–120). IGI Global Scientific Publishing.
Grassi, L., Figini, N., & Fedeli, L. (2022). How does a data strategy enable customer value? The case of FinTechs and traditional banks under the open finance framework. Financial Innovation, 8(1), 1–34. https://doi.org/10.1186/s40854-022-00353-x
Ha, D., Le, P., & Nguyen, D. K. (2025). Financial inclusion and fintech: A state-of-the-art systematic literature review. Financial Innovation, 11(1), 69.
Han, L., Lv, Q., & Zhang, Q. (2025). Digital financial inclusion, credit access and non-farm employment. Finance Research Letters, 72, 106510.
He, Z., Huang, J., & Zhou, J. (2023). Open banking: Credit market competition when borrowers own the data. Journal of Financial Economics, 147(2), 449–474. https://doi.org/10.1016/j.jfineco.2022.12.006
Iman, N., Nugroho, S. S., Junarsin, E., & Pelawi, R. Y. (2023). Is technology truly improving the customer experience? Analysing the intention to use open banking in indonesia. International Journal of Bank Marketing, 41(7), 1521–1549. https://doi.org/10.1108/IJBM-04-2023-0205
Jin, L., & Liu, M. (2024). Unlocking financial opportunities: The substantial alleviation of financing constraints on small and micro enterprises through digital inclusive finance. Journal of the Knowledge Economy, 1–27.
Johri, A., Asif, M., Tarkar, P., Khan, W., Wasiq, M., et al. (2024). Digital financial inclusion in micro enterprises: Understanding the determinants and impact on ease of doing business from world bank survey. Humanities and Social Sciences Communications, 11(1), 1–10.
Kokkinis, A., & Miglionico, A. (2020). Open banking and libra: A new frontier of financial inclusion for payment systems? Singapore Journal of Legal Studies, 601–629. https://www.jstor.org/stable/27032628
Kowalewski, O., & Pisany, P. (2022). The rise of fintech: A cross-country perspective. Management Science, 68(12), 8437–8458. https://doi.org/10.1287/mnsc.2022.4401
Li, L., & Liu, Q. (2024). Analyzing financial inclusion with explainable machine learning: Evidence from an emerging economy. Journal of Digital Economy, 3, 275–287.
Liu, X., & Zhao, Q. (2024). Banking competition, credit financing and the efficiency of corporate technology innovation. International Review of Financial Analysis, 94, 103248.
Liu, Z., Li, X., & Li, Z. (2024). Inclusive FinTech, open banking, and bank performance: Evidence from china. Financial Innovation, 10(1), 149.
Mahato, J., & Kanth, D. (2025). Investigating the influence of digital financial inclusion on the performance of family firms in india: Does financial well-being mediate? Global Knowledge, Memory and Communication. https://doi.org/10.1108/GKMC-08-2024-0515
Marín, A. G., & Schwabe, R. (2019). Bank competition and financial inclusion: Evidence from mexico. Review of Industrial Organization, 55(2), 257–285. https://doi.org/10.1007/s11151-019-09695-y
Nazaritehrani, A., & Mashali, B. (2020). Development of e-banking channels and market share in developing countries. Financial Innovation, 6(1), 12.
Nguyen, T. T., Do, M. H., Rahut, D. B., Nguyen, V. H., & Chhay, P. (2023). Female leadership, internet use, and performance of agricultural cooperatives in vietnam. Annals of Public and Cooperative Economics, 94(3), 877–903. https://doi.org/10.1111/apce.12434
Niankara, I., Hassan, H. I., Traoret, R. I., & Islam, A. R. M. (2025). Consumer savings and digital remittance in open banking: Insights from bibliometric and geospatial econometric analysis. Human Behavior and Emerging Technologies, 2025(1), 9352257.
Niankara, I., & Traoret, R. I. (2023). The digital payment-financial inclusion nexus and payment system innovation within the global open economy during the COVID-19 pandemic. Journal of Open Innovation: Technology, Market, and Complexity, 9(4), 100173. https://doi.org/10.1016/j.joitmc.2023.100173
Norden, L., & Ribeiro, T. (2025). Local credit in brazil: The role of digital connectivity and education. Emerging Markets Review, 65, 101265. https://doi.org/10.1016/j.ememar.2024.101265
Okijie, S. R., & Effiong, U. E. (2024). Financing and successful micro, small and medium scale enterprise development in nigeria. East African Finance Journal, 3(1), 1–26.
Parameswaran, S., & Kadam, A. (2025). Access to formal credit for women-owned enterprises in india’s unorganized sector: Does technology adoption help close the gender gap? Applied Economics. https://doi.org/10.1080/00036846.2025.2526853
Peprah, J. A., Koomson, I., Sebu, J., & Bukari, C. (2021). Improving productivity among smallholder farmers in ghana: Does financial inclusion matter? Agricultural Finance Review, 81(4), 481–502. https://doi.org/10.1108/AFR-11-2020-0172
Perrin, C., & Weill, L. (2022). No man, no cry? Gender equality and financial inclusion around the world. Journal of Economic Behavior & Organization, 194, 366–378. https://doi.org/10.1016/j.jebo.2021.12.013
Preziuso, M., Koefer, F., & Ehrenhard, M. (2023b). Open banking and inclusive finance in the european union: Perspectives from the dutch stakeholder ecosystem. Financial Innovation, 9(1), 111.
Preziuso, M., Koefer, F., & Ehrenhard, M. (2023a). Open banking and inclusive finance in the european union: Perspectives from the dutch stakeholder ecosystem. Financial Innovation, 9(1), 111. https://doi.org/10.1186/s40854-023-00488-5
Prívara, A., Mészáros, R., & Rahmat, N. R. (2025). From digital investment to economic performance: Insights from EU25 economies. Review of Accounting and Finance. https://doi.org/10.1108/RAF-02-2025-0049
Rastogi, S., Goel, A., & Doifode, A. (2023). Open APIs in banking and inclusive growth: An innovation to support the poverty eradication programs in india. Journal of Banking Regulation, 24(4), 432–444. https://doi.org/10.1057/s41261-022-00208-6
Sadok, H., Sakka, F., & El Maknouzi, M. (2022). Artificial intelligence and bank credit analysis: A review. Cogent Economics & Finance, 10(1), 2023262. https://doi.org/10.1080/23322039.2021.2023262
Shihadeh, F. H. (2018). How individual’s characteristics influence financial inclusion: Evidence from MENAP countries. International Journal of Islamic and Middle Eastern Finance and Management, 11(4), 589–606. https://doi.org/10.1108/IMEFM-05-2017-0122
Tanchangya, T., Islam, N., Naher, K., Mia, M. R., Chowdhury, S., Sarker, S. R., & Rashid, F. (2025). Financial technology-enabled sustainable finance for small-and medium-sized enterprises. Environment, Innovation and Management, 1, 2550006.
Türüç, F., & k-Erbilen, S. (2025). The role of human capital and energy transition in driving economic growth in sub-saharan africa. Sustainability (Switzerland), 17(11). https://doi.org/10.3390/su17114889
Vo, D. H. (2025). Long-term effects of institutional quality on financial inclusion in asia–pacific countries. Financial Innovation, 11(1), 59.
Weber, R., & Musshoff, O. (2013). Can flexible microfinance loans improve credit access for farmers? Agricultural Finance Review, 73(2), 255–271. https://doi.org/10.1108/AFR-09-2012-0048
Williams, K. (2025). Foreign banks, asymmetric information and financial inclusion in emerging and developing countries. Emerging Markets Finance and Trade, 61(3), 669–683.
Wojtys, M., Marra, G., & Radice, R. (2018). Copula based generalized additive models for location, scale and shape with non-random sample selection. Computational Statistics & Data Analysis, 127, 1–14. https://doi.org/10.1016/j.csda.2018.05.014
World Bank. (2022). Global financial inclusion (global findex) database 2021. World Bank, Development Data Group.
World Bank Enterprise Survey. (2025). Data. https://www.enterprisesurveys.org/en/data.
Zeller, B., & Lynch, B. (2020). Challenges in open banking—what are the practical steps to be taken now? University of Western Australia Law Review, 48, 579–591.