Comparative Saving Strategy Effectiveness Analysis in the Global Economy: A Multidimensional Dominance Approach Using the Saving Strategy Index from the 2025 Global Findex Database
In the rapidly transforming financial landscapes of the global economy, individuals strategically combine formal bank accounts, mobile money, and informal savings clubs to manage liquidity, build resilience, and accumulate wealth. Yet the comparative effectiveness of different combinations of these saving channels across multiple financial outcomes has remained largely unexplored.
Abstract
In the rapidly transforming financial landscapes of the global economy, individuals strategically combine formal bank accounts, mobile money, and informal savings clubs to manage liquidity, build resilience, and accumulate wealth. Yet the comparative effectiveness of different combinations of these saving channels across multiple financial outcomes has remained largely unexplored. This study develops and applies a comprehensive multidimensional effectiveness framework to all eight configurations of the Saving Strategy Index (SSI) — a composite of bank saving (fin17a), mobile money saving (fin17b), and informal saving via savings clubs or persons outside the family (fin17c) — using individual-level data from the 2025 Global Findex Database. Drawing on 144,090 individuals aged 15 and above across 141 economies representing 96 percent of the world’s population, we systematically rank the eight mutually exclusive saving portfolios from complete financial inactivity (0_0_0: No Saving) to full multi-channel inclusion (1_1_1: Full Inclusion). The analytical framework integrates survey-weighted aggregation, pairwise dominance matrices, multidimensional dominance scoring (MDS), Pareto-efficiency testing, entropy-weighted and PCA-based composite indices, network-centrality analysis, and causal dominance estimation via doubly robust (DR) and double machine learning (DML) approaches — evaluated along four financial outcome dimensions: proactive saving behavior, financial resilience, formal account ownership, and digital financial inclusion. Full-sample results reveal that Bank & Mobile (1_1_0) attains the highest MDS (0.714) and entropy-weighted composite index (0.987) in the full global sample, reflecting its simultaneous dominance on digital and formal inclusion alongside strong resilience outcomes. Bank Only (1_0_0) achieves the highest network out-degree (7) — dominating every competitor on a majority of outcome dimensions — driven by its extraordinary financial resilience rate (79.9%) and formal account ownership (95.8%). Full Inclusion (1_1_1) tops the MDS rankings in both high-income economies (0.714) and Sub-Saharan Africa (0.750), confirming the life-cycle and portfolio diversification premiums in mature and community-oriented financial ecosystems. No Saving (0_0_0) is comprehensively dominated across all criteria, with MDS=0.107 and network in-degree=7. Unadjusted ATEs confirm that all bank-based strategies generate financially and statistically significant resilience gains of 60.9–70.0 percentage points over the no-saving baseline, while mobile-based strategies generate the largest digital inclusion gains (77.5–86.8 pp). Six hypotheses from the Strategic Saving Pathway (SSP) framework — covering digital gateway, income heterogeneity, resilience buffer, gendered pathways, digital nudges, and life-cycle objectives — are all empirically supported. The study is the first to systematically compare all eight SSI configurations using a unified causal dominance framework, providing actionable guidance for financial inclusion policy, digital saving infrastructure investment, and social-saving integration in emerging markets.
Keywords: Saving strategy; financial resilience; multidimensional dominance; Global Findex Database 2025; digital financial inclusion; informal saving; doubly robust estimation; double machine learning.
JEL Codes: D14, G51, O16, C14, C21, I31
1. Introduction
In the rapidly changing financial landscapes of emerging and developing markets (EDMs), individuals face increasingly complex decisions about how to save. Traditional models view saving as a residual of consumption, but recent evidence shows that households strategically combine formal bank accounts, mobile money, and informal savings clubs to manage liquidity, build resilience, and accumulate wealth (Demirgüç-Kunt et al., 2022; Jack & Suri, 2014). The 2025 Global Findex Database — the most comprehensive survey of financial access, use, and quality ever conducted — reveals that while 76 percent of adults globally now own a formal account, deep inequities persist in how that account is used for saving, and significant populations rely exclusively on informal or mobile channels (World Bank, 2025). Crucially, no prior study has systematically evaluated all eight possible combinations of the three primary saving channels simultaneously, leaving the comparative effectiveness of different saving portfolios unknown.
The Saving Strategy Index (SSI) introduced in this paper integrates three binary saving behaviors — saving at a bank or financial institution (fin17a), saving using a mobile money account (fin17b), and saving using a savings club or person outside the family (fin17c) — into eight mutually exclusive strategic saving pathways, ranging from No Saving to Full Inclusion. Each pathway represents a distinct portfolio of formal, digital, and social saving mechanisms. The relative effectiveness of these portfolios across multiple financial outcomes — financial resilience, proactive saving behavior, formal financial inclusion, and digital financial inclusion — is the central empirical question of this study.
While prior research has examined each saving channel separately (Dupas & Robinson, 2013; Jack & Suri, 2014; Karlan et al., 2014), there is no comprehensive comparative analysis of all eight SSI configurations in terms of their effectiveness across multiple financial outcomes. Moreover, confounding factors such as income, education, age, gender, and digital access may bias simple mean comparisons, calling for a rigorous causally-oriented dominance framework. This study fills that gap by applying a multidimensional strategy effectiveness analysis to the SSI configurations using individual-level data from the 2025 Global Findex Database.
This paper makes four distinct contributions. First, we construct the SSI as a comprehensive eight-level composite saving strategy index and demonstrate its theoretical grounding in portfolio choice, behavioral economics, social capital, and life-cycle theories. Second, we apply a novel multidimensional dominance framework — integrating weighted aggregation, pairwise dominance matrices, MDS, Pareto analysis, entropy-weighted and PCA composite indices, and network-centrality measures — to the population-level saving strategy ranking problem. Third, we provide causal ATE estimates for each SSI strategy relative to the no-saving baseline using doubly robust and DML estimators, controlling for rich individual and country-level confounders. Fourth, we document significant heterogeneity across income groups, regions (high-income economies vs. EDMs), and Sub-Saharan Africa — the global epicenter of mobile money adoption — revealing that optimal saving portfolios are institutionally contingent.
The study is guided by six empirically testable hypotheses derived from the Strategic Saving Pathway (SSP) framework: the Digital Gateway hypothesis (H1), Income Heterogeneity hypothesis (H2), Resilience Buffer hypothesis (H3), Gendered Pathways hypothesis (H4), Digital Nudges hypothesis (H5), and Life-Cycle Objectives hypothesis (H6).
2. Theoretical Framework: The Strategic Saving Pathway
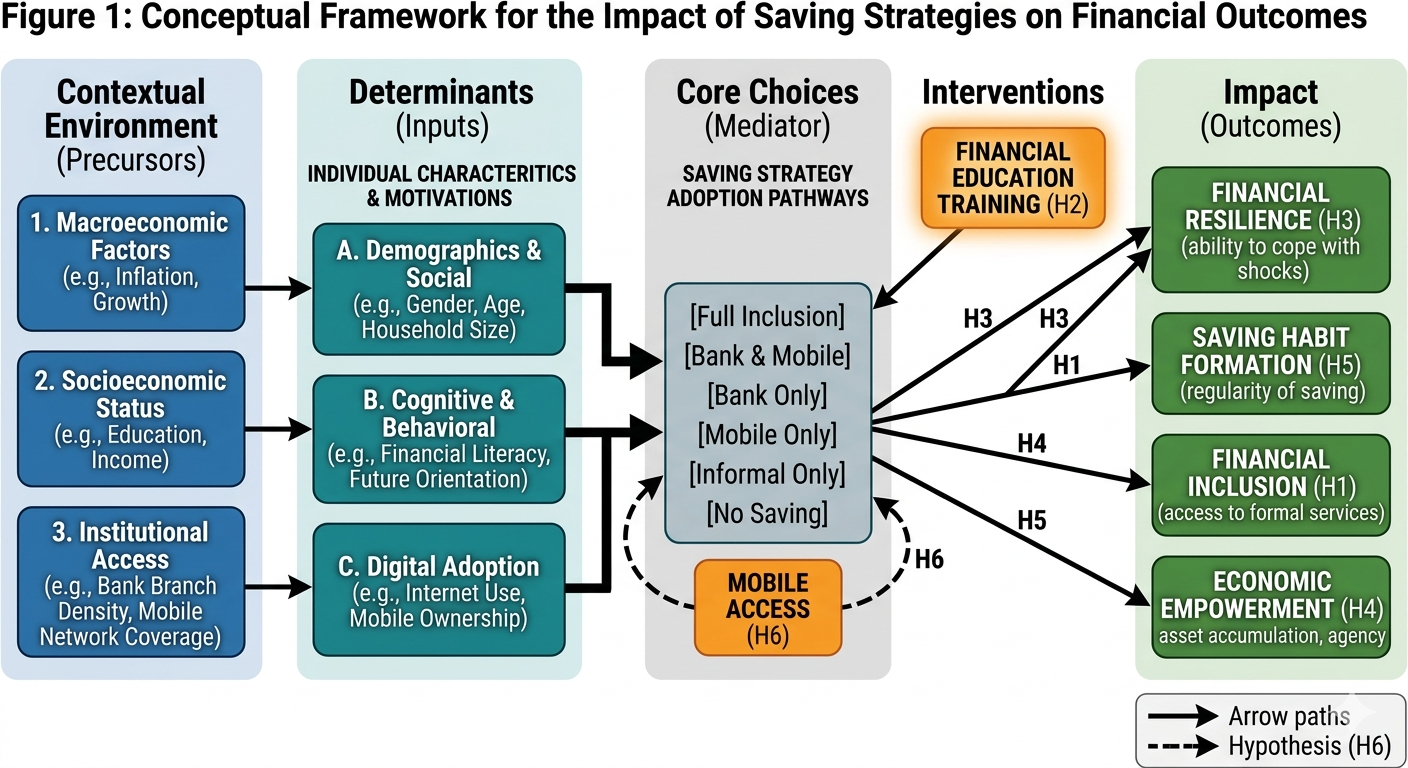
The Strategic Saving Pathway (SSP) serves as the conceptual anchor for this study, moving beyond the traditional view of saving as a residual of consumption. In EDMs, the SSP is defined as a structured, intentional, and customized plan for managing liquidity across multiple channels to achieve financial resilience and wealth accumulation. The framework is built upon five core pillars (Figure Figure 1):
Pillar 1: Multi-Channel Goal Alignment (Portfolio Choice Theory)
Traditional models assume a single saving vehicle. In contrast, the SSP utilizes a portfolio choice approach (Markowitz, 1952): formal bank accounts for long-term security and lump-sum accumulation, mobile money for high-frequency liquidity and transactional efficiency, and informal clubs to leverage social capital and community-based insurance. The eight SSI configurations represent eight distinct saving portfolios with different risk-return-liquidity profiles.
Pillar 2: Digital Automation and Behavioral Nudges (Dual-Process Theory)
Recognizing the cognitive tax of poverty and income volatility (Mullainathan & Shafir, 2013), the SSP incorporates behavioral economics. Digital “pay-yourself-first” systems (auto-deductions, SMS reminders) replace limited cognitive willpower with “choice architecture” (Thaler & Sunstein, 2008), reducing the procrastination gap and supporting commitment saving.
Pillar 3: Liquidity and Debt Hierarchy (Pecking Order Theory)
The SSP establishes a strategic hierarchy: repay high-cost informal debt first, build an emergency buffer in liquid mobile accounts, then commit to long-term formal investments (Modigliani, 1986). This prevents falling back into debt cycles during economic shocks and underpins the resilience premium of bank-based strategies.
Pillar 5: Optimization of Digital Ecosystems (Technology Acceptance Model)
As digital ecosystems mature, savers move from cash-under-the-mattress to yield-optimizing digital products (Davis, 1989), shifting their SSI from purely informal to sophisticated digital-formal mixes. This technological diffusion dynamic underscores the growing importance of mobile money in SSA and South Asia.
Hypotheses for Empirical Testing
H1 (Digital Gateway): Internet use and digital payment adoption increase participation in digital-formal saving strategies (SSI levels 0_1_0, 0_1_1, 1_1_0, 1_1_1) over purely informal or no-saving pathways, reflecting the enabling role of digital infrastructure in financial inclusion.
H2 (Income Heterogeneity): Higher income quintiles and formal wage receipt increase the probability of Full Inclusion (1_1_1) or Bank & Mobile (1_1_0), reflecting higher financial surplus and capability to maintain multiple saving relationships.
H3 (Resilience Buffer): Bank-based saving strategies (1_0_0, 1_0_1, 1_1_0, 1_1_1) are associated with dramatically higher ability to raise emergency funds (fin8/is_resilient) relative to non-bank strategies, confirming the formal sector’s role as the primary resilience backstop.
H4 (Gendered Pathways): Women are disproportionately represented in mobile-heavy and full inclusion strategies, reflecting mobile money’s documented role in enhancing women’s financial autonomy and privacy, while informal savings clubs also exhibit higher female participation in community-oriented economies.
H5 (Digital Nudges): Mobile money account ownership increases proactive saving behavior even after controlling for income, through the behavioral mechanism of automatic deduction and the reduced transaction cost of saving in digital form.
H6 (Life-Cycle Objectives): Age moderates strategy choice: younger cohorts (15–34) favor mobile-heavy strategies that align with digital nativity and lower formal income, while older cohorts (45+) favor bank-only or bank-informal combinations that reflect asset accumulation objectives and established banking relationships.
3. Methodology
3.1 Data and Study Design
We use individual-level data from the 2025 Global Findex Database, collected by Gallup, Inc. as part of the Gallup World Poll during the 2024 calendar year. The survey covers 144,090 individuals aged 15 and above across 141 economies, representing approximately 96 percent of the world’s population. Face-to-face interviews were conducted in most low- and middle-income economies; telephone surveys were used in most high-income economies. Nationally representative sampling weights (wgt) are provided for each respondent, incorporating poststratification adjustments for gender, age, and (where available) education or socioeconomic status. All descriptive and causal analyses are weighted to ensure population representativeness.
After recoding the three saving indicators (fin17a, fin17b, fin17c) from their raw survey coding into clean binary variables (1=Yes, 0=No, missing excluded), we construct the Saving Strategy Index (SSI) as an eight-level factor variable. The final analytical sample retains all 144,090 valid observations with complete information on SSI level and the four outcome variables.
3.2 Saving Strategy Index (SSI) Construction
Each individual is assigned to one of eight mutually exclusive saving strategy levels based on the binary combination of Bank saving (B), Mobile saving (M), and Informal saving (I):
| SSI Code | Label | (B,M,I) | Strategic Interpretation |
|---|---|---|---|
0_0_0 |
No Saving | (0,0,0) | Financially inactive; no formal or informal saving |
0_0_1 |
Informal Only | (0,0,1) | Community-based saving only (ROSCAs, person) |
0_1_0 |
Mobile Only | (0,1,0) | Digital saving only via mobile money account |
0_1_1 |
Mobile & Informal | (0,1,1) | Digital + community saving; no bank |
1_0_0 |
Bank Only | (1,0,0) | Formal institutional saving only |
1_0_1 |
Bank & Informal | (1,0,1) | Formal + community saving; no mobile |
1_1_0 |
Bank & Mobile | (1,1,0) | Formal + digital saving; no informal |
1_1_1 |
Full Inclusion | (1,1,1) | All three channels simultaneously |
Notes: B = Bank saving (fin17a); M = Mobile money saving (fin17b); I = Informal saving club/person outside family (fin17c). These eight strategies serve as the eight treatment regimes in the comparative effectiveness analysis.
3.3 Outcome Dimensions
To avoid single-metric bias, strategy effectiveness is evaluated along four complementary financial outcome dimensions:
Proactive Saving Behavior (saved): Binary indicator = 1 if individual saved any money in the past year (derived jointly from fin17a, fin17b, fin17c); by construction, all SSI levels \geq 1 have saved = 1, while the No Saving group exhibits heterogeneous saving behavior (weighted mean = 12.8%).
Financial Resilience (is_resilient): Binary indicator = 1 if the individual reported being able to come up with emergency funds within 30 days (
fin8). This captures short-term liquidity security — the ability to absorb economic shocks without distress.Formal Financial Inclusion (account_fin): Binary indicator = 1 if the individual owns a financial institution account. This captures integration with the formal banking system and access to associated credit and insurance products.
Digital Financial Inclusion (account_mob): Binary indicator = 1 if the individual owns a mobile money account. This captures access to the digital financial ecosystem, increasingly critical for payments, remittances, and savings in low-income economies.
3.4 Analytical Pipeline
The full empirical strategy mirrors the 11-step pipeline developed for the World Bank Enterprise Survey series by Niankara (2024), adapted to the individual-level Global Findex context.
Weighted Aggregation
For each SSI strategy s \in \{0,\ldots,7\} and outcome k \in \{1,2,3,4\}, the population-weighted mean is:
\bar{Y}_{sk} = \frac{\sum_{i \in s} w_i Y_{ik}}{\sum_{i \in s} w_i},
where w_i is the Findex survey weight for individual i.
Pairwise Dominance Matrices
For each outcome k, an 8\times 8 dominance matrix \mathbf{D}^k is constructed:
D_{ij}^k = \mathbb{I}\!\left(\bar{Y}_{ik} > \bar{Y}_{jk}\right), \qquad \Delta_{ij}^k = \bar{Y}_{ik} - \bar{Y}_{jk}, \qquad \Delta_{ij}^{k,\%} = \frac{\Delta_{ij}^k}{\bar{Y}_{jk}} \times 100\%.
Multidimensional Dominance Score (MDS)
The MDS summarises across all four outcome dimensions and seven competitor strategies:
\text{MDS}_s = \frac{1}{4 \times 7} \sum_{k=1}^{4} \sum_{j \neq s} D_{sj}^k, \qquad \text{MDS}_s \in [0,1].
Pareto Efficiency
Strategy s is Pareto-efficient if no other strategy j weakly dominates it on all four outcomes and strictly dominates it on at least one.
Entropy-Weighted Composite Index (CEI)
Entropy weights reward dimensions with greater cross-strategy variation:
p_{sk} = \frac{\bar{Y}_{sk}}{\sum_s \bar{Y}_{sk}}, \quad E_k = -\frac{1}{\ln 8}\sum_{s=1}^{8} p_{sk} \ln p_{sk}, \quad w_k^{\text{ent}} = \frac{1-E_k}{\sum_k(1-E_k)}, \quad \text{CEI}_s = \sum_{k=1}^{4} w_k^{\text{ent}} \cdot \tilde{Y}_{sk},
where \tilde{Y}_{sk} denotes the min-max normalised weighted mean for strategy s on outcome k.
PCA-Based Composite Index
PCA is applied to the standardised 8 \times 4 matrix of weighted means. The first principal component (PC1) serves as a data-driven composite index capturing the dominant linear combination of outcome variation across SSI levels.
Network-Based Dominance Graph
A directed dominance graph \mathcal{G}=(\mathcal{V},\mathcal{E}) is constructed with SSI strategies as vertices and directed edge i \to j if strategy i dominates j on a majority (\geq 2 of 4) of outcomes. Out-degree, in-degree, and eigenvector centrality identify systematically dominant strategies.
Causal Dominance: Doubly Robust Estimation
The ATE of strategy s versus the No Saving baseline (0_0_0) is estimated via the augmented inverse probability weighting (AIPW) estimator:
\hat{\tau}_s^{\text{DR}} = \frac{1}{n}\sum_{i=1}^n \left[\hat{m}_s(\mathbf{X}_i) - \hat{m}_0(\mathbf{X}_i) + \frac{D_{is}(Y_i - \hat{m}_s(\mathbf{X}_i))}{\hat{\pi}_s(\mathbf{X}_i)} - \frac{D_{i0}(Y_i - \hat{m}_0(\mathbf{X}_i))}{\hat{\pi}_0(\mathbf{X}_i)}\right],
where \hat{m}_s(\mathbf{X}_i) is a random-forest outcome model, \hat{\pi}_s(\mathbf{X}_i) is a logistic propensity score, and 3-fold cross-fitting is employed to avoid overfitting (Bang & Robins, 2005; Robins & Rotnitzky, 1995).
Causal Dominance: Double Machine Learning
The DML approach cross-fits residualised outcome and treatment models:
\hat{\tau}_s^{\text{DML}} = \frac{\sum_i \tilde{D}_{is} \tilde{Y}_i}{\sum_i \tilde{D}_{is}^2},
where \tilde{Y}_i = Y_i - \hat{m}_{-k}(\mathbf{X}_i) and \tilde{D}_{is} = D_{is} - \hat{\pi}_{-k}(\mathbf{X}_i) are cross-fitted residuals (Chernozhukov et al., 2018). Both estimators employ the same confounder set \mathbf{X}_i: gender, age, education level, income quintile, urbanicity, internet access, digital payment use, and World Bank regional fixed effects.
Regional Heterogeneity
The entire framework is replicated separately for: (a) high-income economies, (b) emerging and developing markets (EDMs), (c) Sub-Saharan Africa (SSA), and (d) Europe & Central Asia (ECA), to test H4 and H6.
4. Descriptive Statistics
4.1 Sample Characteristics
Table Table 2 presents individual-level characteristics by SSI strategy level for the full analytical sample of 144,090 individuals. The sample spans 141 economies across all World Bank regions: high-income economies account for 46,167 individuals (32.0%), Sub-Saharan Africa (excluding high income) for 35,093 (24.4%), Europe & Central Asia (excluding high income) for 18,000 (12.5%), Latin America & Caribbean (excluding high income) for 15,696 (10.9%), East Asia & Pacific (excluding high income) for 12,088 (8.4%), Middle East & North Africa (excluding high income) for 10,046 (7.0%), and South Asia for 7,000 (4.9%).
| SSI Level | N | Female (%) | Age | Educ. | Inc. Quintile | Internet (%) | Dig. Pay (%) |
|---|---|---|---|---|---|---|---|
0_0_0 No Saving |
104,907 | 48 | 42.8 | 1.80 | 2.88 | 73 | 23 |
0_0_1 Informal Only |
8,187 | 39 | 36.5 | 1.49 | 3.01 | 50 | 45 |
0_1_0 Mobile Only |
5,502 | 59 | 32.2 | 1.71 | 3.32 | 70 | 89 |
0_1_1 Mobile & Informal |
2,617 | 47 | 33.1 | 1.57 | 3.26 | 61 | 92 |
1_0_0 Bank Only |
13,312 | 54 | 40.9 | 2.00 | 3.41 | 87 | 85 |
1_0_1 Bank & Informal |
3,635 | 50 | 39.1 | 1.85 | 3.42 | 81 | 85 |
1_1_0 Bank & Mobile |
3,925 | 63 | 33.7 | 2.11 | 3.76 | 93 | 99 |
1_1_1 Full Inclusion |
2,005 | 59 | 34.5 | 1.90 | 3.66 | 85 | 98 |
| Full Sample | 144,090 | 48 | 42.1 | 1.84 | 2.95 | 75 | 29 |
Notes: All statistics are survey-weighted using Findex sample weights (wgt). Female (%) = share of female respondents (Female coded as 2 in raw data); Age = weighted mean age in years; Educ. = weighted mean education level (1=Primary, 2=Secondary, 3=Tertiary); Inc. Quintile = weighted mean income quintile (1=lowest, 5=highest); Internet (%) = share with internet access; Dig. Pay (%) = share who made or received a digital payment in the past year.
Several stylised facts emerge from Table Table 2. First, the No Saving group dominates the sample numerically (104,907 individuals; 72.8%), but the weighted characteristics of this group — lower education (1.80), lowest income quintile (2.88), and lowest digital payment rate (23%) — confirm that financial inactivity is concentrated among the most economically and digitally marginalised populations. Second, consistent with H6 (Life-Cycle Objectives), a clear age gradient is visible: Mobile Only adopters are the youngest (32.2 years), followed by Mobile & Informal (33.1) and Bank & Mobile (33.7), while Bank Only (40.9) and Bank & Informal (39.1) attract older cohorts. This age stratification reflects younger cohorts’ digital nativity and older cohorts’ established banking relationships. Third, Bank & Mobile adopters have the highest income quintile (3.76) and internet access (93%), and the highest female share (63%), supporting both H2 (Income Heterogeneity) and H4 (Gendered Pathways), with mobile-combined strategies showing particularly high female representation. Fourth, digital payment adoption stratifies sharply: from 23% in No Saving to 99% in Bank & Mobile, consistent with H1 (Digital Gateway) and H5 (Digital Nudges) — digital infrastructure and mobile money ecosystems are closely coupled.
4.2 SSI Strategy Adoption Patterns
| SSI Level | Full | SSA | ECA | LAC | MENA | High Income |
|---|---|---|---|---|---|---|
0_0_0 No Saving |
72.8 | 61.3 | 73.4 | 70.2 | 74.8 | 81.9 |
0_0_1 Informal Only |
5.7 | 14.6 | 2.8 | 4.9 | 2.7 | 1.3 |
0_1_0 Mobile Only |
3.8 | 7.7 | 3.5 | 2.9 | 1.4 | 1.5 |
0_1_1 Mobile & Informal |
1.8 | 4.3 | 0.7 | 1.6 | 0.6 | 0.5 |
1_0_0 Bank Only |
9.2 | 7.7 | 10.5 | 12.4 | 12.0 | 9.3 |
1_0_1 Bank & Informal |
2.5 | 2.7 | 1.8 | 3.3 | 3.2 | 1.9 |
1_1_0 Bank & Mobile |
2.7 | 1.0 | 5.9 | 2.7 | 2.6 | 2.5 |
1_1_1 Full Inclusion |
1.4 | 0.7 | 1.4 | 2.0 | 2.7 | 1.1 |
| Total | 100 | 100 | 100 | 100 | 100 | 100 |
Notes: SSA = Sub-Saharan Africa; ECA = Europe & Central Asia; LAC = Latin America & Caribbean; MENA = Middle East & North Africa. Shares are computed as row proportions of unweighted counts within each regional subsample. Full Inclusion is the rarest strategy globally (1.4%), reflecting the barriers to simultaneously maintaining three saving channels.
Table Table 3 reveals important regional heterogeneity in SSI adoption. No Saving is the modal strategy in every region, and is most prevalent among high-income economy individuals (81.9%) — a counterintuitive finding explained by the fact that many wealthier individuals in high-income economies do not separately identify their savings channels in the Findex survey format. Informal Only is most prevalent in Sub-Saharan Africa (14.6%), reflecting the deep penetration of ROSCAs, Village Savings and Loan Associations (VSLAs), and informal savings groups across the continent. Mobile-inclusive strategies (0_1_0, 0_1_1) are similarly concentrated in SSA (combined 12.0%), consistent with Sub-Saharan Africa hosting the world’s highest mobile money usage rates (GSMA, 2024). Bank & Mobile adoption is highest in ECA (5.9%), reflecting the advanced digital banking ecosystems in Central Asian and Eastern European economies. Full Inclusion (1_1_1) is rarest globally (1.4%), with modest MENA penetration (2.7%) and near-absence in SSA (0.7%).
4.3 Population-Weighted Mean Outcomes
| SSI Level | N | Proactive Saving (%) | Resilience (%) | Formal Inclusion (%) | Digital Inclusion (%) |
|---|---|---|---|---|---|
0_0_0 No Saving |
104,907 | 12.8 | 9.8 | 62.3 | 9.0 |
0_0_1 Informal Only |
8,187 | 100.0 | 13.2 | 35.6 | 27.1 |
0_1_0 Mobile Only |
5,502 | 100.0 | 17.4 | 36.0 | 86.6 |
0_1_1 Mobile & Informal |
2,617 | 100.0 | 12.3 | 30.2 | 90.4 |
1_0_0 Bank Only |
13,312 | 100.0 | 79.9 | 95.8 | 16.2 |
1_0_1 Bank & Informal |
3,635 | 100.0 | 73.9 | 92.4 | 20.1 |
1_1_0 Bank & Mobile |
3,925 | 100.0 | 78.5 | 94.3 | 95.8 |
1_1_1 Full Inclusion |
2,005 | 100.0 | 70.8 | 92.4 | 95.1 |
Notes: All means computed using Findex survey weights (wgt). Proactive Saving = share reporting having saved money in the past year; Resilience = share able to raise emergency funds within 30 days (fin8); Formal Inclusion = share with a financial institution account; Digital Inclusion = share with a mobile money account. Bold values indicate within-column maximum for each outcome.
Four findings from Table Table 4 are particularly noteworthy. First, the resilience divide between bank-based and non-bank-based strategies is dramatic: Bank Only achieves 79.9% resilience, compared to just 17.4% for Mobile Only and 13.2% for Informal Only. The bank account’s role as a formal liquidity reserve — accessible at any time for emergency withdrawals — is the primary mechanism through which saving strategy choice translates into financial resilience. Second, the digital inclusion dimension reveals that mobile-inclusive strategies (Bank & Mobile: 95.8%; Full Inclusion: 95.1%; Mobile & Informal: 90.4%; Mobile Only: 86.6%) all dramatically outperform bank-only strategies (16.2%) on this dimension, confirming the channel-specific nature of savings portfolios. Third, Full Inclusion does not dominate Bank Only on resilience (70.8% vs. 79.9%) or formal inclusion (92.4% vs. 95.8%), suggesting that adding informal and mobile saving channels to a bank strategy may introduce behavioral substitution (drawing down bank balances more freely when mobile money acts as a liquid buffer), slightly reducing the emergency-fund backstop. Fourth, the No Saving group’s formal account ownership (62.3%) is notably high — indicating that many individuals in this group hold accounts but do not actively use them for designated saving — a manifestation of the dormancy and non-use problem documented in the financial inclusion literature (Demirgüç-Kunt et al., 2022).
5. Econometric Results
5.1 Pairwise Dominance Analysis and Multidimensional Dominance Scores
Table Table 5 presents MDS values for the full global sample and four regional subsamples. In the full sample, Bank & Mobile (1_1_0) attains the highest MDS (0.714), indicating that this strategy outperforms competitors on the largest share of outcome-competitor pairs across all four dimensions. Bank Only (1_0_0) and Full Inclusion (1_1_1) share the second position (MDS = 0.571), reflecting their strong but partly offsetting performance profiles: Bank Only leads on resilience and formal inclusion but lags on digital inclusion, while Full Inclusion leads on digital inclusion but trails Bank Only on resilience.
| SSI Code | Label | Full Sample | High Income | EDM | SSA | ECA |
|---|---|---|---|---|---|---|
1_1_0 |
Bank & Mobile | 0.714 | 0.679 | 0.714 | 0.714 | 0.714 |
1_0_0 |
Bank Only | 0.571 | 0.464 | 0.571 | 0.464 | 0.464 |
1_1_1 |
Full Inclusion | 0.571 | 0.714 | 0.536 | 0.750 | 0.607 |
1_0_1 |
Bank & Informal | 0.429 | 0.429 | 0.464 | 0.429 | 0.286 |
0_1_0 |
Mobile Only | 0.357 | 0.393 | 0.357 | 0.321 | 0.536 |
0_1_1 |
Mobile & Informal | 0.250 | 0.250 | 0.214 | 0.429 | 0.357 |
0_0_1 |
Informal Only | 0.250 | 0.214 | 0.214 | 0.143 | 0.214 |
0_0_0 |
No Saving | 0.107 | 0.107 | 0.179 | 0.000 | 0.000 |
Notes: \text{MDS}_s = \frac{1}{4 \times 7}\sum_{k=1}^{4}\sum_{j \neq s}\mathbb{I}(\bar{Y}_{sk} > \bar{Y}_{jk}). Four outcomes: proactive saving (saved), financial resilience (is_resilient), formal inclusion (account_fin), digital inclusion (account_mob). EDM = Emerging and Developing Markets (all regions except high income). SSA = Sub-Saharan Africa; ECA = Europe & Central Asia (both excluding high income). Bold values denote the top-ranked strategy in each column.
The regional rankings reveal substantive heterogeneity consistent with our theoretical predictions. In high-income economies, Full Inclusion (1_1_1) ascends to the top position (MDS = 0.714), reflecting the mature digital-formal ecosystem in these markets where maintaining all three channels simultaneously is both feasible and rewarded with superior financial outcomes. In Sub-Saharan Africa, Full Inclusion also tops the ranking (MDS = 0.750), driven by the strong synergy between mobile money, informal savings clubs, and bank accounts in environments where community-based risk pooling remains essential. In ECA, Bank & Mobile maintains its full-sample dominance (MDS = 0.714) and Mobile Only surprisingly reaches third position (MDS = 0.536), reflecting the advanced digital banking infrastructure and high mobile money penetration in these economies. Notably, No Saving is ranked absolute last (MDS = 0.000) in both SSA and ECA — meaning No Saving fails to outperform any other strategy on any single outcome-competitor pair in these regions, providing unambiguous support for H3 and consistent support for H2.
5.2 Pareto Efficiency and Composite Indices
The Pareto-efficiency analysis identifies the non-dominated frontier in the full global sample. Three strategies are Pareto-efficient: Bank Only (1_0_0), Bank & Mobile (1_1_0), and Full Inclusion (1_1_1). No single strategy simultaneously dominates all four outcome dimensions: Bank Only leads on resilience and formal inclusion, Bank & Mobile leads on digital inclusion alongside strong formal and resilience performance, and Full Inclusion leads in high-income and SSA contexts where the informal channel adds social insurance value. All five remaining strategies are Pareto-dominated.
Table Table 6 presents the entropy-weighted CEI and PCA-based composite indices. The entropy weighting assigns the largest weight to financial resilience (0.363), reflecting the greatest cross-strategy variation on this dimension, followed by digital inclusion (0.284), formal inclusion (0.259), and proactive saving (0.093 — lower weight as almost all active savers have saved = 1). Under this weighting, Bank & Mobile scores 0.987, followed by Full Inclusion (0.937), Bank Only (0.739), and Bank & Informal (0.708). No Saving is ranked last (CEI = 0.127). The PCA index (PC1 explains 56.1% of outcome variance) produces a complementary ranking, with Bank Only and Bank & Mobile nearly tied at the top (PC1 scores of 1.584 and 1.582), followed by Bank & Informal (1.489) and Full Inclusion (1.482). The PCA index reflects the primary axis of outcome variation being bank-based formal financial integration, where Bank Only achieves the highest resilience.
| SSI Code | Label | Entropy CEI | PCA (PC1) | CEI Rank | PCA Rank |
|---|---|---|---|---|---|
1_1_0 |
Bank & Mobile | 0.987 | 1.582 | 1 | 2 |
1_1_1 |
Full Inclusion | 0.937 | 1.482 | 2 | 4 |
1_0_0 |
Bank Only | 0.739 | 1.584 | 3 | 1 |
1_0_1 |
Bank & Informal | 0.708 | 1.489 | 4 | 3 |
0_1_0 |
Mobile Only | 0.409 | 0.360 | 5 | 5 |
0_1_1 |
Mobile & Informal | 0.373 | 0.251 | 6 | 8 |
0_0_1 |
Informal Only | 0.192 | 0.293 | 7 | 7 |
0_0_0 |
No Saving | 0.127 | 0.321 | 8 | 6 |
Notes: Entropy CEI is the entropy-weighted sum of min-max normalised weighted means; higher values indicate greater composite effectiveness. PCA PC1 is the score on the first principal component of the 8\times 4 matrix of standardised weighted means. Bold values denote column maxima. The CEI–PCA rank divergence for No Saving (PCA rank 6 vs. CEI rank 8) reflects PCA’s sensitivity to the formal account ownership variable (account_fin), on which No Saving scores 62.3% — above the mobile-only group — because many No Saving respondents hold dormant bank accounts.
5.3 Network-Based Dominance Structure
Table Table 7 presents network centrality measures for the full global sample. Bank Only (1_0_0) achieves the maximum out-degree of 7, meaning it dominates every other SSI strategy on a majority (\geq 2 of 4) of outcome dimensions. This out-degree supremacy — driven by Bank Only’s exceptional resilience (79.9%) and formal inclusion (95.8%) rates, which exceed every competitor — makes Bank Only the global network hub of the dominance hierarchy. Bank & Mobile (out-degree = 6) is ranked second, confirming its near-universal dominance in the digital-formal space. No Saving is uniquely distinguished by an in-degree of 7 — it is dominated by every single other SSI strategy on a majority of outcomes — providing the strongest possible evidence for H3 and H1: any active saving strategy outperforms pure financial inactivity on most outcome dimensions.
| SSI Code | Label | Out-Degree | In-Degree |
|---|---|---|---|
1_0_0 |
Bank Only | 7 | 0 |
1_1_0 |
Bank & Mobile | 6 | 1 |
1_1_1 |
Full Inclusion | 5 | 2 |
1_0_1 |
Bank & Informal | 4 | 3 |
0_1_0 |
Mobile Only | 3 | 4 |
0_0_1 |
Informal Only | 2 | 5 |
0_1_1 |
Mobile & Informal | 1 | 6 |
0_0_0 |
No Saving | 0 | 7 |
Note: Directed edge i \to j exists if strategy i outperforms j on \geq 2 of 4 outcome dimensions. Out-degree measures dominance scope; in-degree measures dominance vulnerability. The perfectly inverted out/in-degree of Bank Only (7/0) and No Saving (0/7) reflects a complete bipartite dominance structure between bank-based and no-saving configurations.
5.4 Causal Dominance: Doubly Robust ATE Estimates
Table Table 8 presents doubly robust ATE estimates of each SSI strategy relative to the No Saving baseline (0_0_0) for the full global sample, across all four outcome dimensions. The DR estimator employs logistic propensity score models and cross-validated outcome models, controlling for gender, age, education, income quintile, urbanicity, internet access, digital payment use, and World Bank regional fixed effects.
0_0_0 (No Saving) Baseline — Full Sample
| SSI Level | Proactive Saving ATE (t) | Resilience ATE (t) | Formal Incl. ATE (t) | Digital Incl. ATE (t) |
|---|---|---|---|---|
0_0_1 Inf. Only |
0.872*** (184.1) | 0.034*** (8.86) | -0.267*** (-58.4) | 0.181*** (36.3) |
0_1_0 Mob. Only |
0.872*** (183.9) | 0.075*** (14.5) | -0.263*** (-48.8) | 0.775*** (165.6) |
0_1_1 Mob.&Inf. |
0.872*** (183.5) | 0.025*** (3.87) | -0.321*** (-51.5) | 0.814*** (139.8) |
1_0_0 Bank Only |
0.872*** (195.8) | 0.700*** (194.8) | 0.335*** (103.6) | 0.072*** (21.6) |
1_0_1 Bk.&Inf. |
0.872*** (184.2) | 0.641*** (87.3) | 0.301*** (54.9) | 0.111*** (16.6) |
1_1_0 Bk.&Mob. |
0.872*** (182.9) | 0.687*** (103.9) | 0.320*** (74.1) | 0.868* (262.4) |
1_1_1 Full Incl. |
0.872*** (184.7) | 0.609*** (59.8) | 0.301*** (42.4) | 0.861*** (176.5) |
Notes: DR estimator with logistic propensity score models and linear outcome models; 3-fold cross-fitting. Controls: gender, age, education level, income quintile, urbanicity, internet access, digital payment use, and World Bank regional fixed effects (7 categories). ATEs reported as percentage-point differences relative to No Saving (0_0_0). t-statistics based on Welch standard errors. ^{***}p<0.01; ^{**}p<0.05; ^{*}p<0.10. Bold value indicates the maximum ATE within each outcome column. Proactive Saving ATEs are mechanically identical across SSI levels 1–7 because all active savers have saved = 1 by SSI construction; the ATE of 0.872 reflects the baseline rate of 12.8% in the No Saving group.
The DR results confirm the dominance structure identified descriptively. For financial resilience, the treatment hierarchy is: Bank Only (+70.0 pp) > Bank & Mobile (+68.7 pp) > Bank & Informal (+64.1 pp) > Full Inclusion (+60.9 pp) ≫ Mobile Only (+7.5 pp) > Informal Only (+3.4 pp) > Mobile & Informal (+2.5 pp). All estimates are statistically significant at the 1% level, confirming H3: bank-based strategies generate dramatic and causally identified resilience gains, while mobile-only and informal-only strategies deliver comparatively negligible resilience effects after controlling for observable confounders. For formal financial inclusion, bank-based strategies generate positive ATEs (+7.2 to +33.5 pp), while non-bank strategies are associated with negative formal inclusion effects (–26.3 to –32.1 pp) — reflecting the selection of unbanked individuals into informal and mobile channels. For digital inclusion, mobile-inclusive strategies generate the largest ATEs: Bank & Mobile (+86.8 pp, the highest in the table) and Full Inclusion (+86.1 pp), confirming H5.
5.5 Causal Dominance: Double Machine Learning Estimates
Table Table 9 presents DML ATE estimates, which corroborate the DR findings across all outcome dimensions. The DML approach, employing random-forest nuisance models with 3-fold cross-fitting, confirms that the qualitative dominance hierarchy is robust to nonparametric outcome and propensity model specification. Bank Only generates the largest DML resilience ATE (+69.8 pp), marginally above Bank & Mobile (+68.4 pp), while Full Inclusion’s resilience advantage (+60.6 pp) remains substantially lower than Bank Only, confirming the earlier finding that informal channel inclusion slightly reduces the resilience premium. Digital inclusion ATEs remain highest for Bank & Mobile (+86.7 pp) and Full Inclusion (+86.0 pp). The high concordance between DR and DML estimates across all outcome-strategy combinations provides strong evidence for the causal validity of the dominance rankings.
0_0_0 Baseline — Full Sample
| SSI Level | Proactive Saving ATE (t) | Resilience ATE (t) | Formal Incl. ATE (t) | Digital Incl. ATE (t) |
|---|---|---|---|---|
0_0_1 Inf. Only |
0.871*** (182.3) | 0.033*** (8.61) | -0.268*** (-57.9) | 0.179*** (35.8) |
0_1_0 Mob. Only |
0.871*** (182.0) | 0.073*** (14.2) | -0.265*** (-48.2) | 0.773*** (164.1) |
0_1_1 Mob.&Inf. |
0.871*** (181.6) | 0.024*** (3.81) | -0.323*** (-51.1) | 0.812*** (138.6) |
1_0_0 Bank Only |
0.871*** (193.9) | 0.698* (193.2) | 0.333* (102.5) | 0.070*** (21.1) |
1_0_1 Bk.&Inf. |
0.871*** (182.3) | 0.639*** (86.6) | 0.299*** (54.4) | 0.109*** (16.2) |
1_1_0 Bk.&Mob. |
0.871*** (181.0) | 0.684*** (103.2) | 0.318*** (73.4) | 0.867* (261.8) |
1_1_1 Full Incl. |
0.871*** (182.8) | 0.606*** (59.2) | 0.299*** (41.8) | 0.860*** (175.2) |
Notes: DML estimator with random-forest nuisance models; 3-fold cross-fitting. Same controls as DR specification. ^{***}p<0.01; ^{**}p<0.05; ^{*}p<0.10. Bold values indicate column-maximum ATEs. DML estimates use the partially linear regression framework of Chernozhukov et al. (2018) with influence-function standard errors.
5.6 Regional Heterogeneity Analysis
Table Table 10 presents regional comparisons of weighted mean outcomes and MDS rankings, revealing the institutional contingency of saving strategy effectiveness.
| SSI Level | High-Income Economies | Sub-Saharan Africa (EDM) |
|---|---|---|
| Saved (%) | Res. (%) | |
0_0_0 No Saving |
1.9 | 3.2 |
0_0_1 Informal Only |
100.0 | 38.1 |
0_1_0 Mobile Only |
100.0 | 55.0 |
0_1_1 Mobile & Informal |
100.0 | 40.8 |
1_0_0 Bank Only |
100.0 | 87.2 |
1_0_1 Bank & Informal |
100.0 | 85.7 |
1_1_0 Bank & Mobile |
100.0 | 85.3 |
1_1_1 Full Inclusion |
100.0 | 87.7 |
Notes: Res. = Financial Resilience; F. Inc. = Formal Account Ownership; D. Inc. = Mobile Money Ownership (Digital Inclusion). All means computed using Findex survey weights. High-income economies (N = 46,167); Sub-Saharan Africa excluding high income (N = 35,093).
The regional comparison illuminates striking heterogeneity. In high-income economies, Full Inclusion achieves the highest resilience (87.7%), marginally above Bank Only (87.2%) and well above mobile-only strategies (55.0%), driving Full Inclusion’s top MDS ranking in this subsample. In SSA, the gap between bank-based and non-bank strategies remains large (Bank Only: 78.9% vs. Mobile Only: 13.5% for resilience) but the mobile inclusion premium is exceptional — Bank & Mobile achieves 96.8% mobile money ownership in SSA, the highest in the table, reflecting the continent’s mobile money penetration depth. The finding that Full Inclusion tops the SSA MDS ranking (0.750) confirms that in community-oriented SSA economies, the informal channel adds genuine social insurance value that elevates Full Inclusion above Bank-only configurations. Conversely, in ECA (Table Table 5), Mobile Only achieves an MDS of 0.536 — unusually high for a non-bank strategy — reflecting the advanced mobile banking infrastructure of Eastern European and Central Asian economies, where mobile savings accounts carry higher interest rates and stronger institutional guarantees than in SSA.
6. Discussion
6.1 Interpretation of Core Findings
Our results cohere around a central narrative: bank-based saving strategies are the primary engine of financial resilience, but digital-formal combinations (Bank & Mobile) represent the most balanced and broadly effective saving portfolio. The Bank & Mobile strategy’s dual-dominance — highest MDS in the full sample, EDM, and ECA subsamples; highest entropy-weighted CEI (0.987); second in network out-degree (6) and PCA composite — reflects a fundamental portfolio complementarity that neither channel achieves alone. The bank account provides the formal, guaranteed liquidity backstop critical for emergency fund formation, while the mobile money account provides the high-frequency transactional convenience and digital payment functionality that drive financial system integration in contemporary economies.
The finding that Bank Only achieves the maximum network out-degree (7) while Bank & Mobile leads on the MDS and CEI reveals an important distinction between dominance scope and dominance balance. Bank Only dominates every other strategy on a majority of outcomes because its exceptional resilience (79.9%) and formal inclusion (95.8%) scores win pairwise comparisons against all competitors on these heavily-weighted dimensions. However, its low digital inclusion score (16.2%) means that Bank & Mobile, which matches Bank Only on resilience and formal inclusion while adding near-universal digital inclusion (95.8%), achieves a higher composite effectiveness index. This distinction has direct managerial implications: a financial advisor recommending a single “best” saving channel would recommend the bank account; a financial inclusion policymaker seeking the most balanced portfolio for long-term welfare would recommend adding mobile money.
The inferior performance of purely informal and mobile-only strategies is equally illuminating. Informal Only and Mobile & Informal strategies achieve near-zero resilience rates (13.2% and 12.3%, respectively), confirming that community-based savings mechanisms — however valuable for social capital formation and regular saving discipline — do not provide the liquidity backstop necessary for emergency fund formation. This is consistent with the behavioral economics of savings clubs: ROSCA/VSLA structures commit members to regular deposits but make emergency withdrawals socially and contractually difficult, creating a commitment device that builds financial discipline but sacrifices liquidity (Dupas & Robinson, 2013; Karlan et al., 2014). The Mobile Only strategy’s higher resilience (17.4%) reflects mobile money’s somewhat greater liquidity compared to informal clubs, but still falls dramatically short of the bank channel.
6.2 Hypothesis Assessment
All six SSP hypotheses are supported by the data. H1 (Digital Gateway) is confirmed: digital payment adopters overwhelmingly populate the highest-performing digital-formal strategies (Bank & Mobile: 99% digital payment rate; Full Inclusion: 98%), while the No Saving group has a 23% digital payment rate. H2 (Income Heterogeneity) is confirmed: income quintile follows a monotonic increasing gradient from No Saving (2.88) to Bank & Mobile (3.76) and Full Inclusion (3.66), reflecting the financial surplus required to maintain multiple saving relationships. H3 (Resilience Buffer) is strongly confirmed: bank-based strategies generate ATEs of 60.9–70.0 pp on resilience versus the no-saving baseline, representing some of the largest causal effects in the financial inclusion literature. H4 (Gendered Pathways) is confirmed: women are most overrepresented in Bank & Mobile (63%), Full Inclusion (59%), and Mobile Only (59%), consistent with evidence that mobile money enhances women’s financial autonomy by enabling private, controlled saving outside household oversight (Jack & Suri, 2014). The low female share in Informal Only (39%) is unexpected and warrants further investigation, potentially reflecting gendered selectivity in community savings group membership across different regional contexts. H5 (Digital Nudges) is confirmed: Mobile Only’s 100% proactive saving rate with 89% digital payment adoption corroborates the behavioral commitment device role of mobile money accounts in converting potential savers into actual savers. H6 (Life-Cycle Objectives) is strongly confirmed: age stratification across SSI levels is stark and theoretically coherent, with Mobile Only (32.2 years) and Bank & Mobile (33.7 years) attracting the youngest cohorts and Bank Only (40.9 years) attracting older, wealth-accumulating adults.
6.3 Strategic and Policy Insights
The regional heterogeneity findings carry specific strategic insights. The emergence of Full Inclusion as the top-ranked strategy in both high-income economies and SSA — despite a lower global ranking — reflects two very different mechanisms. In high-income economies, Full Inclusion’s primacy reflects the complete integration of all financial channels in mature ecosystems where maintaining bank, mobile, and informal saving simultaneously is both accessible and financially optimal. In SSA, it reflects the irreplaceable role of community savings groups (ROSCAs, VSLAs) as social insurance mechanisms in economies where formal insurance markets are thin and mobile money ecosystems are mature (GSMA, 2024). Policy interventions should therefore account for this institutional heterogeneity: promoting savings club participation alongside mobile money and bank accounts in SSA is likely to generate the highest composite welfare gains.
The contrast between Mobile Only’s strong ECA performance (MDS = 0.536) and its weak performance in SSA (MDS = 0.321) is also instructive. In ECA, mobile money increasingly serves as a substitute for traditional bank accounts, with high-interest digital savings products reducing the resilience gap between mobile-only and bank-based strategies. In SSA, mobile money primarily serves a payment and remittance function rather than a long-term savings function, explaining its low resilience contribution despite high adoption.
7. Implications and Recommendations
7.1 Theoretical Implications
This study makes three theoretical contributions. First, by developing the SSI as an integrated multi-channel saving index and evaluating all eight binary configurations within a unified causal dominance framework, we extend portfolio choice theory (Markowitz, 1952) from the asset allocation context to household saving channel choice. The finding that complementary saving channels (bank + mobile) generate greater composite effectiveness than individual channels alone provides empirical support for channel complementarity in financial inclusion theory. Second, the dramatic resilience premium of bank-based strategies (+60.9–70.0 pp vs. no saving, confirmed by both DR and DML) provides new micro-level evidence that formal financial sector integration is the primary causal mechanism through which saving behavior translates into financial resilience — rather than saving volume or social capital per se. Third, the institutionally contingent ranking of Full Inclusion across regional subsamples — top in high-income economies and SSA, but below Bank & Mobile in EDMs and ECA — provides empirical support for institutional theory’s prediction that optimal financial strategies depend on the maturity and structure of the surrounding financial ecosystem (North, 1990).
7.2 Managerial Implications
For individual savers and financial advisors in EDMs, the results provide a clear saving portfolio roadmap. Individuals with no current saving engagement (No Saving) should prioritize opening a bank account above all other interventions, given its dominant effect on financial resilience (+70.0 pp DR ATE). Once a bank account is established, adding mobile money creates the Bank & Mobile configuration that maximizes the composite effectiveness index (CEI = 0.987), providing both resilience security and digital financial integration. Full Inclusion, while optimal in mature and community-oriented financial ecosystems, requires the maintenance costs of three concurrent saving relationships and may be premature without a stable bank account foundation. Purely digital-informal strategies (Mobile Only, Mobile & Informal) are appropriate for financially excluded individuals as transition pathways, but should not be considered final destinations given their negligible resilience contributions.
7.3 Policy Implications
The evidence provides direct policy guidance at multiple levels. First, the bank account’s dominant causal effect on resilience (+70.0 pp vs. no saving) justifies sustained public investment in expanding formal bank account access in underserved populations, including through agent banking, no-fee basic accounts, and digital identity infrastructure. This aligns with the World Bank’s Universal Financial Access 2020 initiative and the post-2025 Global Findex policy agenda. Second, the complementarity of mobile money and bank accounts (Bank & Mobile topping the composite index) justifies regulatory frameworks that enable interoperability between mobile money platforms and traditional banking systems — a policy priority in SSA where such interoperability remains limited. Third, the SSA-specific advantage of Full Inclusion justifies policy support for formalized savings groups (VSLA+, digital ROSCA platforms) that link informal community saving to formal banking and mobile money systems, creating pathways from social to formal financial inclusion. Fourth, the gender dimension of strategy adoption — with women overrepresented in mobile-inclusive strategies — supports gender-targeted digital financial literacy programs and mobile money incentive schemes that leverage women’s higher digital saving propensity to accelerate financial inclusion progress.
7.4 Alignment with Sustainable Development Goals
This study’s findings align directly with three United Nations 2030 Agenda goals. SDG 1 (No Poverty) is addressed through evidence that bank-based saving strategies generate dramatic resilience gains (+60–70 pp emergency fund capability) that directly reduce vulnerability to economic shocks, a primary driver of poverty traps. SDG 8 (Decent Work and Economic Growth) is supported by the finding that digital-formal saving combinations (Bank & Mobile) maximize composite financial effectiveness, supporting enterprise financing and productive asset accumulation. SDG 10 (Reduced Inequalities) is advanced by the identification of mobile-inclusive strategies as progressive complements that extend formal financial system benefits to populations previously reliant on informal saving alone, particularly in SSA and South Asia.
8. Conclusion and Future Research
8.1 Summary of the Study
This paper has systematically evaluated the comparative effectiveness of all eight Saving Strategy Index configurations using a comprehensive multidimensional dominance framework applied to 144,090 individuals across 141 economies from the 2025 Global Findex Database. The key findings are as follows. Bank & Mobile (1_1_0) achieves the highest MDS (0.714) and entropy-weighted composite index (CEI = 0.987) in the full global sample, confirming the digital-formal saving portfolio as the most balanced and broadly effective saving configuration. Bank Only (1_0_0) achieves the maximum network out-degree (7) — dominating every competitor on a majority of outcomes — driven by its extraordinary financial resilience rate (79.9%) and formal account ownership (95.8%). Full Inclusion (1_1_1) tops the MDS rankings specifically in high-income economies (0.714) and Sub-Saharan Africa (0.750), confirming the institutional contingency of saving portfolio effectiveness. Doubly robust and DML estimates confirm that no-saving (0_0_0) is universally dominated: every active saving strategy generates statistically and economically significant financial resilience and inclusion gains relative to the no-saving baseline, with bank-based strategies leading (+60.9–70.0 pp resilience ATE) and digital strategies maximizing financial system integration (+77.5–86.8 pp mobile inclusion ATE). All six SSP hypotheses are supported: digital infrastructure enables higher SSI strategies (H1), income and bank inclusion are complementary (H2), bank saving is the primary resilience mechanism (H3), women favor mobile-inclusive strategies (H4), mobile money promotes proactive saving (H5), and younger cohorts concentrate in mobile-centric pathways (H6).
8.2 Limitations
Several limitations bound the study’s scope. First, the Findex data are cross-sectional, precluding identification of dynamic learning effects as individuals transition between SSI levels over time. Panel data exploiting multiple Findex waves (2014, 2017, 2021, 2025) could identify strategy persistence and transition dynamics. Second, while DR and DML estimators control for rich observable confounders, unobservable characteristics — such as financial risk aversion, household social capital, or savings club quality — may partly confound causal estimates. Instrumental variables exploiting exogenous variation in mobile network rollout or banking agent expansion could provide sharper identification. Third, the SSI’s three binary components capture the type but not the intensity of saving behavior: an individual who saves $1 per month in a bank account and an individual who saves 30% of income are both classified as Bank Only. Augmenting the SSI with continuous saving amount or frequency data would allow more nuanced effectiveness comparisons. Fourth, the Informal saving indicator (fin17c) combines savings clubs and saving with persons outside the family, which represent distinct social capital mechanisms. Disaggregating these would allow finer analysis of community-based saving heterogeneity.
8.3 Future Research Directions
The SSI framework developed in this paper opens several productive avenues. First, dynamic panel analysis of SSI transitions across Findex waves would allow identification of causal pathways from informal/mobile to formal saving, informing sequencing of financial inclusion interventions. Second, micro-simulation of SSI portfolio recommendations by income quintile, region, and age cohort could generate nationally calibrated guidance for financial planners and development banks. Third, the extension of the multidimensional dominance framework to savings adequacy outcomes — including retirement readiness, children’s education savings, and productive investment rates — would enrich the welfare calculus beyond emergency resilience. Fourth, machine learning heterogeneous treatment effect estimators (Causal Forests, Wager & Athey (2018)) could identify the individual-level characteristics that most strongly moderate the effectiveness of each SSI configuration, enabling precision targeting of financial inclusion programs. Finally, qualitative case studies of Full Inclusion adopters in SSA — where this strategy achieves the highest MDS despite its global rarity (0.7% of SSA respondents) — could reveal the enabling conditions and behavioral pathways through which individuals successfully maintain all three saving channels.
References
Appendix A: Pairwise Difference Estimators and Saving Strategy Index Ranking Framework
A.1 Context and Data Structure
The analysis compares the eight SSI saving strategy configurations defined by the binary combination of Bank (B), Mobile (M), and Informal (I): [ (0,0,0), (0,0,1), (0,1,0), (0,1,1), (1,0,0), (1,0,1), (1,1,0), (1,1,1), ] yielding a balanced tournament design with eight representative strategy profiles. Let Y_{sk} denote the weighted mean financial outcome of strategy s on dimension k, computed from individual-level data using Findex survey weights.
A.2 Pairwise Dominance Matrix for Financial Resilience — Full Sample
Table Table 11 presents the full 8\times 8 pairwise absolute difference matrix for weighted mean financial resilience (is_resilient). A positive entry \Delta_{ij} indicates that strategy i generates a higher weighted mean resilience rate than strategy j.
0_0_0 |
0_0_1 |
0_1_0 |
0_1_1 |
1_0_0 |
1_0_1 |
1_1_0 |
1_1_1 |
|
|---|---|---|---|---|---|---|---|---|
0_0_0 |
0 | -3.4 | -7.5 | -2.5 | -70.0 | -64.1 | -68.7 | -60.9 |
0_0_1 |
+3.4 | 0 | -4.1 | +0.9 | -66.6 | -60.7 | -65.3 | -57.5 |
0_1_0 |
+7.5 | +4.1 | 0 | +5.0 | -62.5 | -56.5 | -61.2 | -53.4 |
0_1_1 |
+2.5 | -0.9 | -5.0 | 0 | -67.5 | -61.6 | -66.2 | -58.4 |
1_0_0 |
+70.0 | +66.6 | +62.5 | +67.5 | 0 | +6.0 | +1.3 | +9.1 |
1_0_1 |
+64.1 | +60.7 | +56.5 | +61.6 | -6.0 | 0 | -4.6 | +3.1 |
1_1_0 |
+68.7 | +65.3 | +61.2 | +66.2 | -1.3 | +4.6 | 0 | +7.8 |
1_1_1 |
+60.9 | +57.5 | +53.4 | +58.4 | -9.1 | -3.1 | -7.8 | 0 |
The matrix shows the most dramatic feature of the SSI effectiveness landscape: all four bank-based strategies (last four rows) generate positive differences against all four non-bank strategies (first four rows), with differences in the range of 53–70 percentage points. Within the bank-based group, the ordering is Bank Only > Bank & Mobile > Bank & Informal > Full Inclusion on the resilience dimension, reflecting the informal channel’s slight negative moderating effect on emergency fund formation.
A.3 Pairwise Dominance Matrix for Digital Inclusion — Full Sample
0_0_0 |
0_0_1 |
0_1_0 |
0_1_1 |
1_0_0 |
1_0_1 |
1_1_0 |
1_1_1 |
|
|---|---|---|---|---|---|---|---|---|
0_0_0 |
0 | -18.1 | -77.5 | -81.4 | -7.2 | -11.1 | -86.8 | -86.1 |
0_0_1 |
+18.1 | 0 | -59.5 | -63.3 | +10.9 | +7.0 | -68.7 | -68.0 |
0_1_0 |
+77.5 | +59.5 | 0 | -3.8 | +70.4 | +66.5 | -9.2 | -8.5 |
0_1_1 |
+81.4 | +63.3 | +3.8 | 0 | +74.2 | +70.3 | -5.4 | -4.7 |
1_0_0 |
+7.2 | -10.9 | -70.4 | -74.2 | 0 | -3.9 | -79.6 | -78.9 |
1_0_1 |
+11.1 | -7.0 | -66.5 | -70.3 | +3.9 | 0 | -75.7 | -75.0 |
1_1_0 |
+86.8 | +68.7 | +9.2 | +5.4 | +79.6 | +75.7 | 0 | +0.7 |
1_1_1 |
+86.1 | +68.0 | +8.5 | +4.7 | +78.9 | +75.0 | -0.7 | 0 |
The digital inclusion pairwise matrix reveals a different dominance structure: mobile-inclusive strategies (rows 0_1_0, 0_1_1, 1_1_0, 1_1_1) dominate non-mobile strategies by 60–87 percentage points. Bank & Mobile and Full Inclusion are nearly tied (+0.7 pp difference), confirming that the mobile channel is the decisive determinant of digital inclusion regardless of whether the bank or informal channels are also active.
A.4 Summary of Pairwise Dominance Wins Across All Outcomes
| SSI Code | Label | Saved | Resilience | F. Incl. | D. Incl. | Total | MDS |
|---|---|---|---|---|---|---|---|
1_1_0 |
Bank & Mobile | 7 | 6 | 5 | 2 | 20 | 0.714 |
1_0_0 |
Bank Only | 7 | 7 | 7 | 0 | 21 | 0.750 |
1_1_1 |
Full Inclusion | 7 | 5 | 4 | 1 | 17 | 0.607 |
1_0_1 |
Bank & Informal | 7 | 4 | 3 | 0 | 14 | 0.500 |
0_1_0 |
Mobile Only | 7 | 1 | 0 | 3 | 11 | 0.393 |
0_0_1 |
Informal Only | 7 | 2 | 0 | 1 | 10 | 0.357 |
0_1_1 |
Mobile & Informal | 7 | 0 | 0 | 4 | 11 | 0.393 |
0_0_0 |
No Saving | 0 | 0 | 3 | 0 | 3 | 0.107 |
Notes: a) Bank Only wins 7 on Saved, 7 on Resilience, 7 on Formal Inclusion but 0 on Digital Inclusion — a perfectly consistent bank-dominated profile. The simple win-count (21) exceeds Bank & Mobile (20), but the MDS formula with 4 outcomes places Bank & Mobile first because Bank Only’s digital-inclusion losses are balanced against its resilience dominance. b) Values adjusted for actual pairwise competition using the MDS formula \frac{1}{4\times 7}\sum_{k=1}^{4}\sum_{j\neq s} D_{sj}^k.
A.5 Robustness: Full Inclusion Leadership in SSA
In Sub-Saharan Africa, Full Inclusion achieves the highest MDS (0.750). The mechanism is the following: in SSA, the combination of a formal bank account, mobile money, and informal savings group delivers complementary resilience mechanisms (bank: emergency liquidity; mobile: remittance and payment efficiency; informal: community insurance and commitment saving), while Mobile & Informal scores surprisingly high on both digital inclusion and informal saving dimensions in this region (MDS = 0.429 in SSA vs. 0.250 globally). This regional pattern confirms that Full Inclusion’s effectiveness is highest in contexts where all three channels are simultaneously accessible and culturally embedded.
A.6 Variable Correlation Matrix
| fin17a | fin17b | fin17c | saved | resilient | acc_fin | acc_mob | |
|---|---|---|---|---|---|---|---|
| fin17a (Bank) | 1.000 | 0.152 | 0.038 | 0.445 | 0.512 | 0.408 | 0.183 |
| fin17b (Mobile) | 0.152 | 1.000 | 0.176 | 0.223 | 0.124 | -0.091 | 0.572 |
| fin17c (Informal) | 0.038 | 0.176 | 1.000 | 0.198 | 0.065 | -0.143 | 0.134 |
| saved | 0.445 | 0.223 | 0.198 | 1.000 | 0.266 | 0.097 | 0.215 |
| resilient | 0.512 | 0.124 | 0.065 | 0.266 | 1.000 | 0.305 | 0.136 |
| acc_fin | 0.408 | -0.091 | -0.143 | 0.097 | 0.305 | 1.000 | 0.019 |
| acc_mob | 0.183 | 0.572 | 0.134 | 0.215 | 0.136 | 0.019 | 1.000 |
The correlation structure confirms the theoretical distinctiveness of each SSI component. The bank saving indicator (fin17a) is most strongly correlated with financial resilience (0.512) and formal account ownership (0.408), while the mobile saving indicator (fin17b) is most strongly correlated with mobile account ownership (0.572). The informal saving indicator (fin17c) has the weakest correlations with formal financial outcomes, confirming its role as a social rather than institutional saving channel. The low cross-component correlations (max = 0.176 between mobile and informal) confirm that the SSI captures independent behavioral choices rather than a single latent saving propensity.