# Required packages
library(GJRM)
library(ggplot2)
library(maps)
library(dplyr)

# Semi-parametric trivariate probit model with Gaussian copula
# Full model (out4) specification:
# out4 <- gjrm(
#   list(
#     ChecAndORSavAccOwnshp ~ DigitStratg2 + iCert + extAudit + OBApp + Period +
#               size + sector_MS + largFirm + femOwner + logSales +
#               AccsToFinObstOP +
#               s(nyearsOper) + s(legalStat) + s(MangYrExpSect) +
#               s(PercSenManTimGovReg) + s(region),
#     OverDraftFacility ~ DigitStratg2 + iCert + extAudit + OBApp + Period +
#               size + sector_MS + largFirm + femOwner + logSales +
#               AccsToFinObstOP +
#               s(nyearsOper) + s(legalStat) + s(MangYrExpSect) +
#               s(PercSenManTimGovReg) + s(region),
#     LineCredORLoanFinInst ~ DigitStratg2 + iCert + extAudit + OBApp + Period +
#               size + sector_MS + largFirm + femOwner + logSales +
#               AccsToFinObstOP +
#               s(nyearsOper) + s(legalStat) + s(MangYrExpSect) +
#               s(PercSenManTimGovReg) + s(region)
#   ),
#   data = wbes_data,
#   Model = "T",
#   BivD = "N",
#   margins = c("probit", "probit", "probit")
# )Formal Financial Inclusion and Firms’ Access to Operational Credit Facilities in the Open Banking Era
Digitalization Inclusion and Development
Investigates how formal financial inclusion (FFI) influences firms’ access to operational credit—specifically overdrafts and credit lines—in the open banking era. Using firm-level data from 46,831 enterprises across 23 economies (World Bank Enterprise Surveys, 2006–2023) and a semi-parametric trivariate probit model with Gaussian copula, results show that FFI improves overdraft access by 12.5% and credit line access by 7.5%. Digital strategies enhance these effects by up to 12%, while quality certifications and auditing provide additional gains of 3–5%. Findings offer new insights for Signaling Theory and support inclusive open banking reforms aligned with UN SDGs 8 and 9.
Abstract
This study investigates how formal financial inclusion (FFI) influences firms’ access to operational credit—specifically overdrafts and credit lines—in the context of the open banking era. It further explores how digital strategies, international quality certifications, and external auditing shape this relationship. Employing a semi-parametric trivariate probit model with Gaussian copula and random regional effects, the analysis controls for endogeneity and interdependencies in financial access decisions. Using firm-level data from 46,831 enterprises across 23 economies (World Bank Enterprise Surveys, 2006–2023), results show that FFI improves access to overdrafts by 12.5% and credit lines by 7.5%. Digital strategies enhance these effects by up to 12%, while quality certifications and auditing provide additional gains of 3–5%. Firm-level characteristics—such as size, sector, legal status, and open banking regimes—further moderate these effects. The findings offer new insights for Signaling Theory, support inclusive open banking reforms, and contribute to advancing UN SDGs 8 and 9.
Keywords: Access to credit, Discrete Choice Modeling, External Auditing, Financial Inclusion, Open Banking, Sustainable Development Goals
1. Introduction
Formal financial inclusion (FFI), defined as access to and use of formal financial services such as savings accounts, credit, and insurance, has been a cornerstone of economic development since the early 2000s (Demirgüç-Kunt et al., 2018). Historically, small and medium enterprises (SMEs) faced significant barriers to accessing operational credit facilities, such as overdrafts and lines of credit, due to information asymmetries, weak institutional frameworks, and limited collateral (Beck et al., 2008). The emergence of open banking, facilitated by application programming interfaces (APIs) and real-time data sharing, has transformed financial ecosystems by enhancing transparency, fostering competition, and reducing credit evaluation costs (Carriere-Swallow et al., 2021). This digital shift, accelerated by global fintech adoption, has redefined how firms signal creditworthiness and access liquidity in dynamic markets.
As of 2025, approximately 1.2 billion adults globally remain unbanked, with SMEs in emerging economies facing acute credit constraints (World Bank, 2024). Only 57% of SMEs in developing countries have formal financial accounts, and less than 25% secure operational credit facilities (International Finance Corporation, 2023). Open banking frameworks, now implemented in over 60 countries (Niankara et al., 2025), have spurred fintech-bank collaborations, reducing credit processing times by 25–30% and increasing SME loan approvals by 15% (Gogia & Rastogi, 2022). Digital strategies, such as website and email adoption, and external validations like international quality certifications and auditing, are increasingly critical for signaling firm reliability. However, their role in amplifying FFI’s impact on credit access remains underexplored, particularly across diverse economic and regulatory contexts.
While prior research establishes FFI’s role in promoting firm growth (Nizam et al., 2020) and credit access (Gopalan et al., 2020), several gaps persist. First, studies often neglect the endogeneity of financial inclusion, where access to credit facilities may simultaneously drive account ownership (Kede Ndouna & Nembot Ndeffo, 2023; Niankara, 2023). Second, the moderating effects of digital strategies, quality certifications, and external auditing in open banking contexts are understudied (Zhen & Zhou, 2025). Third, the impact of open banking frameworks on operational credit facilities, such as overdrafts, is rarely examined (Kowalewski & Pisany, 2022). Finally, the influence of COVID-19 on post-2020 digital adoption remains underexplored (Mohamed, 2023). Consequently, this study aims to:
- Quantify the impact of FFI on firms’ access to operational credit facilities (overdrafts and credit lines/loans) in the open banking era.
- Evaluate the moderating roles of digital strategies, international quality certifications, and external auditing on the FFI-credit access relationship.
- Assess the influence of firm-specific (e.g., size, sector), ownership (e.g., female ownership), and market factors (e.g., open banking regimes) on credit access outcomes.
- Examine the contribution of FFI and open banking to UN SDGs 8 (Decent Work and Economic Growth) and 9 (Industry, Innovation, and Infrastructure).
The study contributes by: integrating Signaling Theory, Random Utility Theory, and Complexity Theory to model interdependent financial decisions; employing a semi-parametric trivariate probit model with Gaussian copula and random regional effects; providing empirical evidence on amplifying effects of digital strategies and external validations on credit access; and offering actionable policy recommendations aligned with SDGs 8 and 9.
2. Literature Review
2.1 Financial Inclusion and Firm Growth
Financial inclusion is a critical driver of firm growth, particularly for SMEs in developing economies. Nizam et al. (2020) examine the effect of financial inclusion on manufacturing firm growth in Malaysia, Philippines, and Vietnam, finding a non-monotonic effect where financial inclusion significantly boosts growth below a certain credit threshold but diminishes beyond it—suggesting that over-leveraging can hinder performance. Brixiová et al. (2020) demonstrate through propensity score matching that SMEs with access to formal financing in Sub-Saharan Africa create more jobs, particularly in manufacturing. Tongurai & Vithessonthi (2018) show through global panel data (1960–2016) that banking sector development fosters industrial development while exerting a conditional negative effect on agricultural growth.
Kede Ndouna & Nembot Ndeffo (2023) analyze financial inclusion’s impact on SME formalization in Cameroon, finding a 5.3% increase in formalization probability when firms access diverse financial products. T. Liu et al. (2021) find that actual use of credit—rather than mere access—drives entrepreneurial activities and rural economic transformation among farm households in China. Xinyao et al. (2025) reveals that digital inclusive finance lowers financing costs and risks, thereby boosting technological innovation, market competitiveness, and economic efficiency of SMEs.
Critical Evaluation: The literature underscores financial inclusion’s positive impact on firm growth, formalization, and productivity. However, the risk of over-leveraging (Nizam et al., 2020) and the role of open banking in amplifying these effects remain underexplored. The bidirectional relationship between financial inclusion and growth also warrants further exploration.
2.2 Credit Access and Operational Credit Facilities
Access to operational credit facilities is pivotal for firm liquidity management and operational resilience. Weber & Musshoff (2013) find that flexible loan structures increase credit access probabilities by reducing volume rationing. Kadam & Bandyopadhyay (2024) reveal that while entrepreneurs from marginalized castes in India have higher access to formal credit (extensive margin), they receive lower loan amounts (intensive margin), suggesting potential discrimination. X. Liu & Zhao (2024) show that heightened banking competition enhances corporate technology innovation efficiency by lowering credit costs and improving availability.
Sadok et al. (2022) review how AI and big data improve creditworthiness assessments, enhancing access to operational credit. Martı́nez-Sola et al. (2024) find that access to lines of credit significantly increases firm resilience during economic shocks, with formal financial inclusion as a key enabler.
Critical Evaluation: The literature confirms that formal financial access reduces credit constraints, particularly for SMEs. However, the role of open banking in streamlining credit access through real-time data sharing remains underexplored, as does the moderating effect of external validation mechanisms like quality certifications and auditing.
2.3 Role of Digital Technologies and Open Banking
Y. Wang et al. (2025) provide robust empirical evidence showing that digital capabilities improve credit risk assessment and transaction transparency, enhancing trade credit availability. Kowalewski & Pisany (2022) analyze competition between banks and fintech/bigtech credit providers, finding that fintech credit complements bank lending in emerging economies. Dhanorkar et al. (2025) demonstrate that open banking APIs significantly reduce credit evaluation time, improving SME access to operational credit. L. Wang et al. (2025) construct a five-dimensional framework using NLP on Chinese bank data, showing that digital transformation mitigates procyclical leverage and enhances stability, amplifying credit access for SMEs.
Omarini et al. (2018) and Stefanelli & Manta (2023) report that bank-fintech collaborations under open banking frameworks increase credit access for SMEs through enhanced data sharing. Deng (2023) demonstrates that digital transformation of commercial banks substantially enhances monetary policy transmission to SME financing. Overall, real-time data integration in open banking reduces credit rationing for SMEs (Bianco & Vangelisti, 2022).
Critical Evaluation: The transformative potential of open banking and digital technologies in enhancing credit access is well-documented (Colangelo & Khandelwal, 2025). However, the moderating roles of firms’ digital strategies and external validations in open banking contexts are largely absent, providing a key focus for this study.
2.4 Socioeconomic and Institutional Factors in Financial Inclusion
Norden & Ribeiro (2025) find that higher education and broadband access reduce informational asymmetries, increasing credit availability in Brazil. Shihadeh (2018) show that females and the poor are less likely to be financially included in the MENAP region, but education enhances inclusion. Perrin & Weill (2022) find that reducing the gender gap enhances financial stability due to women’s higher loan repayment rates. Srivastava (2025) argues that improved debt enforcement mechanisms reduce the cost of capital and encourage R&D investment. Deku & Morris (2025) reveal through cross-country panel analysis that strong governance mitigates climate-induced declines in traditional banking assets, suggesting that robust regulatory frameworks can enhance financial inclusion’s stability.
Critical Evaluation: The interaction of socioeconomic and institutional factors with open banking frameworks and external validation mechanisms remains underexplored. This study addresses how these factors moderate the financial inclusion-credit access nexus in the open banking era.
2.5 Financial Inclusion and Sustainable Development Goals
Buckley et al. (2021) examine fintech’s role in achieving SDGs, emphasizing that financial inclusion reduces poverty and supports economic growth through affordable financial services. Awaworyi Churchill & Smyth (2020) demonstrate that multidimensional financial inclusion reduces household poverty in Nigeria, aligning with SDG 1. Hussain et al. (2024) report significantly positive long-term economic growth effects of financial inclusion in Asia, supporting SDG 9. Niankara et al. (2025) report open banking frameworks to enhance financial inclusion’s impact on SDG 9 through real-time credit evaluations. Chen et al. (2025) find that mandatory ESG disclosure significantly enhances firms’ access to trade credit by reducing information asymmetry and enhancing stakeholder trust.
Critical Evaluation: The role of open banking in amplifying SDG contributions for firms is underexplored, as is the impact of external validation mechanisms on SDG outcomes.
2.6 Emerging Hypotheses
- H1: Formal financial inclusion positively impacts firms’ access to operational credit facilities, enhancing firm growth in the open banking era.
- H2: Firms with formal financial accounts have higher access to operational credit facilities, moderated by digital strategies and external validation mechanisms.
- H3: Open banking frameworks enhance the relationship between financial inclusion and access to operational credit facilities, with digital strategies and external auditing amplifying this effect.
- H4: Socioeconomic and institutional factors moderate the relationship between financial inclusion and access to operational credit facilities in the open banking era.
- H5: Financial inclusion, enhanced by open banking, contributes to achieving SDG 8 and SDG 9 by improving firms’ access to operational credit facilities.
3. Methodology
3.1 Theoretical Framework
This research leverages three foundational theories: Signaling Theory (ST), Random Utility Theory (RUT), and Complexity Theory (CT). These theories collectively explain why firms make certain financial decisions and how these decisions are interconnected within a broader financial ecosystem. As a theoretical innovation, this model supports the integration of firm, market, and contextual control factors, demonstrating — for the first time in the scientific literature — how firms strategically leverage financial inclusion and external validation to enhance access to operational credit facilities in the emerging paradigm of open banking.
Signaling Theory and Financial Inclusion
Signaling Theory provides a framework for explaining how firms convey their quality and credibility to external stakeholders through observable characteristics (Spence, 1973). In financial markets with significant information asymmetry (Akerlof, 1970; Stiglitz & Weiss, 1981), Formal Financial Inclusion (FFI) such as access to checking or savings accounts serves as a foundational signal of a firm’s financial organization and engagement within the formal financial ecosystem (Niankara & Muqattash, 2020). This initial signal reduces perceived risks for lenders and increases attractiveness for operational credit facilities (Gopalan et al., 2020).
Wahlström (2022) investigates how local credit officers use multidimensional information to evaluate creditworthiness, finding that officer autonomy coupled with centralized oversight fosters richer risk assessment. Takasu (2021) finds that poor discretionary earnings quality raises loan costs, but this effect is mitigated through active bank monitoring — underscoring the importance of external audits and certifications as moderating factors.
External Validation and Market Signaling Strategies
Firms’ External Validation and Market Signaling Strategies (EVMSS) amplify and diversify their signaling potential through three components: (1) Digital strategy — website, mobile app, and email adoption signal technological competence and lower operational risks (Tsou & Chen, 2023); (2) International quality certification — ISO 9001, HACCP, etc. signal operational efficiency and commitment to excellence (Niankara, 2024); (3) External auditing — audited financial statements provide third-party validation of financial transparency and governance (Aduda & Obondy, 2021). Collectively, these signals reduce information asymmetry and enhance a firm’s ability to secure operational credit.
Random Utility Theory
Random Utility Theory (RUT) provides the microeconomic foundation for modeling firms’ discrete choices among financial products (McFadden, 1974). RUT assumes firms maximize perceived utility from financial products, with unobserved factors introducing randomness. Firms’ decisions regarding bank account opening (B), overdraft adoption (O), and credit line adoption (L) are modeled using utility maximization, randomness in utility, and interdependence of utilities. The interdependence of utilities implies that the utility of adopting an overdraft (U_O) depends on financial inclusion (B) and credit line adoption (L), and similarly for U_L (Niankara, 2023).
Complexity Theory
Complexity Theory (CT) views firms’ financial decisions as a complex adaptive process influenced by external and internal factors (Anderson, 1999). CT recognizes interdependence, nonlinearity, path dependency, and emergence: accessing a bank account (B) enables credit facility adoption (O, L) while credit use incentivizes financial inclusion; financial inclusion reduces transaction costs, enhancing credit adoption, which promotes further financial engagement; historical financial inclusion influences current decisions; and aggregated firm decisions lead to system-level changes such as increased financial inclusion or credit market innovations in the open banking era (Gogia & Rastogi, 2022).
3.2 Conceptual Framework
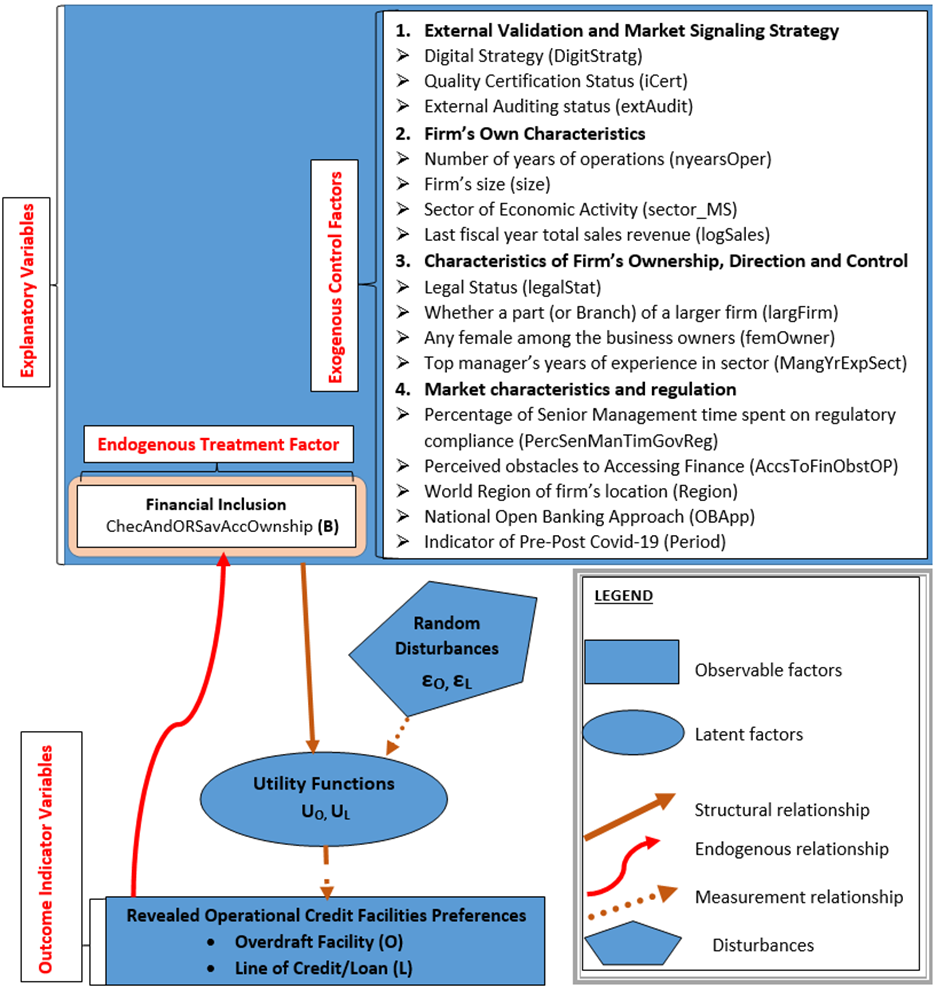
Building on ST, RUT, and CT, the conceptual framework is a multiple controls model capturing the pathways through which FFI influences access to operational credit facilities. As depicted in Figure 1, the framework hypothesizes that, ceteris paribus, firms maximize expected utilities from credit access, subject to financial inclusion status, EVMSS, and firm-specific, market-specific, and contextual factors.
3.3 Data Sources
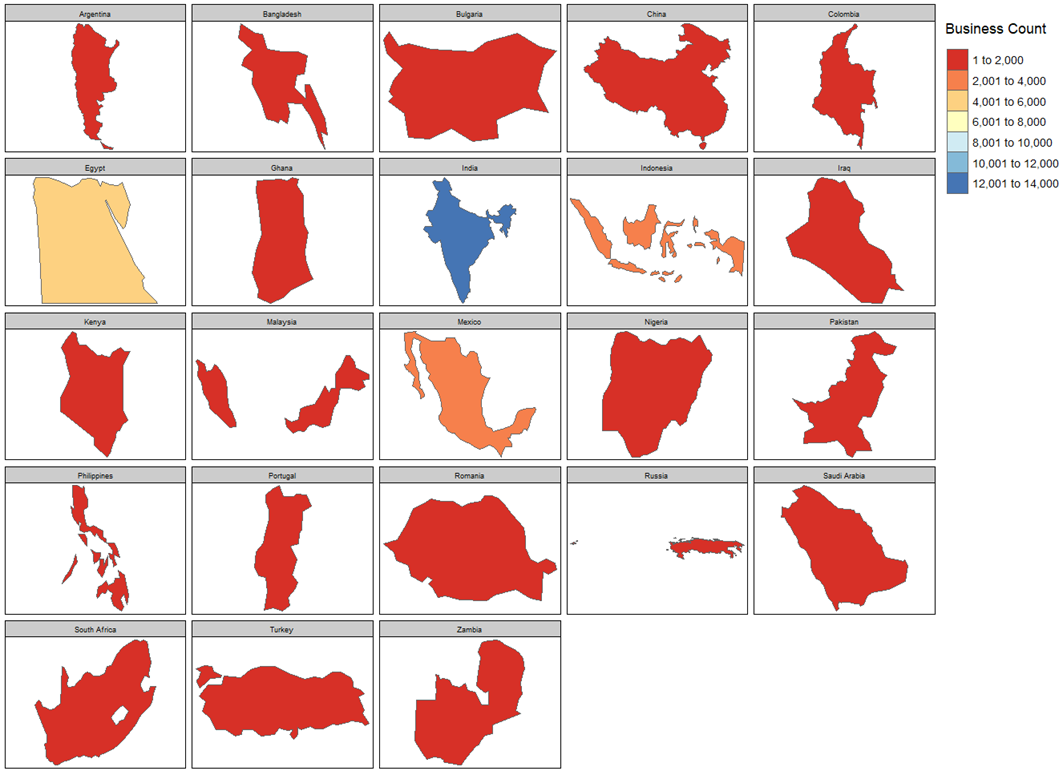
The study utilizes a panel of cross-sectional data from 46,831 firms across 23 economies in Eastern Europe, Southeast Asia, the Middle East, Africa, and Latin America. The data were extracted from the World Bank Enterprise Surveys (WBES) conducted between 2006 and 2023, publicly released on July 5, 2024 (World Bank, 2024). The geographical coverage is mapped in Figure 2.
3.4 Econometric Model Formulation
Building on ST, RUT, and CT, the econometric model captures the interdependent, stochastic, and systemic nature of firms’ decisions regarding financial inclusion (B), overdraft adoption (O), and credit line adoption (L), using a semi-parametric trivariate copula regression as the primary analytical tool (Niankara, 2024).
The model uses an additive random utility maximization framework (Niankara, 2023). Let B denote a firm’s decision to open a checking/savings account, O the adoption of an overdraft facility, and L the adoption of a credit line/loan. The expected utility functions are:
\begin{cases} U_B^* = V_B + \epsilon_B \\ U_{B^c}^* = V_{B^c} + \epsilon_{B^c} \end{cases}, \quad \begin{cases} U_O^* = V_O + \epsilon_O \\ U_{O^c}^* = V_{O^c} + \epsilon_{O^c} \end{cases}, \quad \begin{cases} U_L^* = V_L + \epsilon_L \\ U_{L^c}^* = V_{L^c} + \epsilon_{L^c} \end{cases}
The latent utilities yield observed binary indicators z (bank account), y_1 (overdraft), and y_2 (credit line):
z = \begin{cases} 1 & \text{if } U_B^* - U_{B^c}^* > 0 \\ 0 & \text{otherwise} \end{cases}, \quad y_1 = \begin{cases} 1 & \text{if } U_O^* - U_{O^c}^* > 0 \\ 0 & \text{otherwise} \end{cases}, \quad y_2 = \begin{cases} 1 & \text{if } U_L^* - U_{L^c}^* > 0 \\ 0 & \text{otherwise} \end{cases}
Using notational simplifications (\tilde{V}_k = V_{k^c} - V_k, \tilde{\epsilon}_k = \epsilon_{k^c} - \epsilon_k), the marginal probabilities become:
P[z=1] = \int_{-\infty}^{-\tilde{V}_B} f(\tilde{\epsilon}_B) \, d\tilde{\epsilon}_B, \quad P[y_1=1] = \int_{-\infty}^{-\tilde{V}_O} f(\tilde{\epsilon}_O) \, d\tilde{\epsilon}_O, \quad P[y_2=1] = \int_{-\infty}^{-\tilde{V}_L} f(\tilde{\epsilon}_L) \, d\tilde{\epsilon}_L
To account for interdependence, the joint probability is:
P[z=1, y_1=1, y_2=1] = \int_{-\infty}^{-\tilde{V}_B} \int_{-\infty}^{-\tilde{V}_O} \int_{-\infty}^{-\tilde{V}_L} f(\tilde{\epsilon}_B, \tilde{\epsilon}_O, \tilde{\epsilon}_L, \Sigma) \, d\tilde{\epsilon}_B d\tilde{\epsilon}_O d\tilde{\epsilon}_L
where the variance-covariance matrix is:
\Sigma = \begin{bmatrix} \tilde{\theta}_{BB} & \tilde{\theta}_{BO} & \tilde{\theta}_{BL} \\ \tilde{\theta}_{BO} & \tilde{\theta}_{OO} & \tilde{\theta}_{OL} \\ \tilde{\theta}_{BL} & \tilde{\theta}_{OL} & \tilde{\theta}_{LL} \end{bmatrix}
with identification constraint \tilde{\theta}_{BB} = \tilde{\theta}_{OO} = \tilde{\theta}_{LL} = 1. The observed marginal utilities are:
\tilde{V}_B = \beta_{10} + \beta_{11} \text{DigitStratg} + \beta_{12} \text{iCert} + \beta_{13} \text{extAudit} + \beta_{14} \text{OBApp} + \beta_{15} \text{Period} + \beta_{16} \text{nyearsOper} + \ldots + \beta_{116} \text{region}
\tilde{V}_O = \beta_{20} + \ldots + \beta_{216} \text{region} + \gamma_{BO} Z + \gamma_{LO} y_2
\tilde{V}_L = \beta_{30} + \ldots + \beta_{316} \text{region} + \gamma_{BL} Z + \gamma_{OL} y_1
where \gamma_{BO} and \gamma_{BL} represent the endogenous effects of financial inclusion, and \gamma_{LO} and \gamma_{OL} capture feedback between credit facilities. Estimation assumes a multivariate normal density for probit regression, implemented in R using the GJRM library (Wojtyś et al., 2018).
4. Results
4.1 Descriptive Statistics
Table 1: Descriptive Statistics for Quantitative Variables
| Variable | Min | 1st Qu. | Median | Mean | 3rd Qu. | Max |
|---|---|---|---|---|---|---|
| Years of Operation | 0.00 | 10.00 | 16.00 | 19.93 | 26.00 | 211.00 |
| Log Sales | 0.00 | 15.07 | 16.78 | 16.99 | 18.90 | 33.85 |
| Managerial Experience (Years in Sector) | 1.00 | 10.00 | 15.00 | 17.39 | 25.00 | 72.00 |
| % Senior Management Time on Gov. Regulations | 0.00 | 0.00 | 2.00 | 9.97 | 10.00 | 100.00 |
The average firm has been operating for approximately 19.93 years, spanning startups to long-established enterprises. Log sales have a mean of 16.99 (approximately $16.7 million in nominal terms) with a right-skewed distribution. Managerial experience averages 17.39 years, reflecting substantial sector-specific expertise. The percentage of senior management time devoted to government regulations averages 9.97%, with a highly skewed distribution (median: 2%, max: 100%), suggesting regulatory compliance is a significant burden for a subset of firms.
Table 2: Absolute and Percentage Relative Frequency Distributions for Qualitative Nominal Variables
| Variable | Absolute Frequency | % Distribution |
|---|---|---|
| Overdraft Facility | ||
| No (0) | 28,523 | 60.91% |
| Yes (1) | 18,308 | 39.09% |
| Checking or Savings Account Ownership | ||
| No (0) | 5,985 | 12.78% |
| Yes (1) | 40,846 | 87.22% |
| Line of Credit or Loan from Financial Institution | ||
| No (0) | 37,756 | 80.63% |
| Yes (1) | 9,075 | 19.37% |
| Digital Strategy | ||
| None | 15,819 | 33.78% |
| Website Only | 13,309 | 28.42% |
| Email Only | 6,346 | 13.55% |
| Website and Email | 11,357 | 24.25% |
| International Quality Certification | ||
| No (0) | 34,544 | 73.78% |
| Yes (1) | 12,287 | 26.22% |
| External Audit | ||
| No (0) | 21,285 | 45.45% |
| Yes (1) | 25,546 | 54.55% |
| Firm Size | ||
| Small (5–19 employees) | 20,242 | 43.24% |
| Medium (20–99 employees) | 16,326 | 34.87% |
| Large (100+ employees) | 10,263 | 21.89% |
| Sector | ||
| Manufacturing | 29,221 | 62.41% |
| Services | 17,610 | 37.59% |
| Region | ||
| South Asia (SAR) | 16,999 | 36.30% |
| Europe and Central Asia (ECA) | 6,564 | 14.02% |
| Africa (AFR) | 6,814 | 14.55% |
| East Asia and Pacific (EAP) | 5,924 | 12.65% |
| Latin America and Caribbean (LAC) | 4,613 | 9.85% |
| Middle East and North Africa (MNA) | 5,917 | 12.63% |
| Open Banking Approach | ||
| Not Applicable (NA) | 6,650 | 14.20% |
| Mandatory (MD) | 18,433 | 39.37% |
| Regulatory Oversight (RO) | 17,988 | 38.41% |
| Regulatory Principles (RP) | 3,760 | 8.01% |
| Period | ||
| Pre-COVID (2006–2019) | 25,406 | 54.25% |
| Post-COVID (2020–2023) | 21,425 | 45.75% |
Notably, 87.22% of firms hold a checking or savings account, indicating high financial inclusion, while only 19.37% have a line of credit or loan, highlighting disparities in credit access. Digital strategy adoption shows 33.78% of firms with no digital presence, while 24.25% use both website and email. Regionally, South Asia (36.30%) and Europe and Central Asia (14.02%) dominate the sample.
4.2 Bivariate Associations
Chi-squared test results confirm significant dependencies among all three endogenous variables (all p < 2.2 \times 10^{-16}). Firms without an overdraft facility are more likely to lack a checking/savings account (19.0% vs. 3.0% for those with an overdraft, \chi^2 = 2558.9). Similarly, firms without an overdraft are less likely to have a line of credit/loan (13.4% vs. 28.6%, \chi^2 = 1653.7), and those without a checking/savings account are less likely to have a line of credit/loan (7.8% vs. 21.1%, \chi^2 = 591.93). These strong associations confirm the interdependence of financial inclusion and credit access, supporting the use of a trivariate model.
Key associations with explanatory factors: For overdraft facility adoption, firms with both website and email digital strategies are more likely to have an overdraft (31.4% vs. 19.7% for those without); quality certification (37.1% vs. 19.2%) and external audits (67.5% vs. 46.2%) show strong positive associations. Mandatory open banking regimes are especially strongly associated with overdraft access (58.4% vs. 27.2%). Similar patterns hold for checking/savings account ownership and line of credit/loan access, with digital strategy, quality certification, external audits, firm size, and open banking approaches showing strong positive associations.
4.3 Endogeneity Tests, Convergence, and Model Performance
Table 3: Endogeneity Tests, Algorithm Convergence, and Model Performance
| Test/Metric | Description | Result |
|---|---|---|
| Endogeneity Tests (Lagrange Multiplier) | ||
| Financial Inclusion vs. Overdraft Facility | P-value (H0: No correlation) | 1.52 \times 10^{-192} |
| Conclusion | Reject H0, significant correlation | |
| Financial Inclusion vs. Credit/Loan | P-value (H0: No correlation) | 1.43 \times 10^{-28} |
| Conclusion | Reject H0, significant correlation | |
| Algorithm Convergence | ||
| Base Model (out0) | Largest Absolute Gradient | 1.07 \times 10^{-10} |
| Eigenvalue Range | [465.52, 60600.04] | |
| Trust Region Iterations | 4 | |
| Full Model (out4) | Largest Absolute Gradient | 5.38 \times 10^{-7} |
| Eigenvalue Range | [0.56, 557,328,894] | |
| Trust Region Iterations | 4 (pre-smooth), 8 (within smooth, 3 loops) | |
| Model Fit | ||
| AIC | Base Model (df=30.0000) | 126,370.7 |
| AIC | Full Model (df=125.1046) | 119,271.7 |
| BIC | Base Model (df=30.0000) | 126,633.3 |
| BIC | Full Model (df=125.1046) | 120,366.9 |
The LM tests confirm that financial inclusion is an endogenous determinant of both overdraft and credit line adoption, necessitating joint modeling. The full model’s substantially lower AIC (119,271.7 vs. 126,370.7) and BIC values confirm its superior fit, justifying the inclusion of additional covariates and smoothing terms.
4.4 Estimated Effects
Table 4: Estimated Results — Base Trivariate Model (Model 0)
| Parameter | Chk/Sav Acct Est. (SE) | p-value | Overdraft Est. (SE) | p-value | Credit Line Est. (SE) | p-value |
|---|---|---|---|---|---|---|
| Intercept | 0.4502 (0.0199) | <2e-16*** | −1.1100 (0.0195) | <2e-16*** | −1.4756 (0.0227) | <2e-16*** |
| DigitStratg: Website Only | 0.6581 (0.0211) | <2e-16*** | 0.5653 (0.0165) | <2e-16*** | 0.3280 (0.0187) | <2e-16*** |
| DigitStratg: Email Only | 0.5255 (0.0260) | <2e-16*** | 0.2648 (0.0204) | <2e-16*** | 0.4572 (0.0223) | <2e-16*** |
| DigitStratg: Website & Email | 0.6357 (0.0242) | <2e-16*** | 0.4863 (0.0181) | <2e-16*** | 0.4598 (0.0200) | <2e-16*** |
| International Quality Cert. | 0.1785 (0.0229) | 6.93e-15*** | 0.2628 (0.0149) | <2e-16*** | 0.1420 (0.0160) | <2e-16*** |
| External Audit | 0.5042 (0.0169) | <2e-16*** | 0.3074 (0.0131) | <2e-16*** | 0.1871 (0.0147) | <2e-16*** |
| OBApp: Mandatory | 0.3865 (0.0246) | <2e-16*** | 0.6725 (0.0199) | <2e-16*** | 0.0089 (0.0234) | 0.702 |
| OBApp: Regulatory Oversight | −0.1351 (0.0221) | 9.02e-10*** | −0.0859 (0.0202) | 2.12e-05*** | 0.2337 (0.0228) | <2e-16*** |
| OBApp: Regulatory Principles | 0.3379 (0.0360) | <2e-16*** | 0.1235 (0.0278) | 9.19e-06*** | 0.8190 (0.0293) | <2e-16*** |
| Correlation Parameters | ||||||
| θ₁₂ (Chk. vs. Overdraft) | 0.389 (95% CI: 0.370, 0.408) | |||||
| θ₁₃ (Chk. vs. Credit/Loan) | 0.247 (95% CI: 0.219, 0.266) | |||||
| θ₂₃ (Overdraft vs. Credit/Loan) | 0.335 (95% CI: 0.317, 0.352) |
Table 5: Estimated Results — Full Trivariate Probit Model with Random Regional Effects (Model 1)
| Parameter | Chk/Sav Acct Est. (SE) | p-value | Overdraft Est. (SE) | p-value | Credit Line Est. (SE) | p-value |
|---|---|---|---|---|---|---|
| Intercept | −0.2286 (0.1719) | 0.1836 | −2.3724 (0.1458) | <2e-16*** | −2.0769 (0.2049) | <2e-16*** |
| DigitStratg: Website Only | 0.5041 (0.0244) | <2e-16*** | 0.3195 (0.0192) | <2e-16*** | 0.2067 (0.0228) | <2e-16*** |
| DigitStratg: Email Only | 0.5795 (0.0306) | <2e-16*** | 0.3158 (0.0256) | <2e-16*** | 0.1839 (0.0275) | 2.15e-11*** |
| DigitStratg: Website & Email | 0.7287 (0.0302) | <2e-16*** | 0.4997 (0.0249) | <2e-16*** | 0.1485 (0.0270) | 3.64e-08*** |
| Quality Certification | 0.0952 (0.0246) | 0.0001*** | 0.1519 (0.0162) | <2e-16*** | 0.0449 (0.0176) | 0.0106* |
| External Audit | 0.6063 (0.0187) | <2e-16*** | 0.3065 (0.0141) | <2e-16*** | 0.2303 (0.0161) | <2e-16*** |
| Access to Finance Obstacle | −0.0102 (0.0068) | 0.1357 | 0.0313 (0.0054) | 8.86e-09*** | 0.1457 (0.0059) | <2e-16*** |
| OBApp: Mandatory | 0.2179 (0.0297) | 2.04e-13*** | 0.7316 (0.0228) | <2e-16*** | −0.0246 (0.0263) | 0.3497 |
| OBApp: Regulatory Oversight | 0.1084 (0.0302) | 0.0003*** | 0.0829 (0.0260) | 0.0014** | 0.2696 (0.0299) | <2e-16*** |
| OBApp: Regulatory Principles | 0.4188 (0.0558) | 6.20e-14*** | 0.0308 (0.0436) | 0.4788 | 1.0078 (0.0475) | <2e-16*** |
| Period: Post-COVID | 0.2917 (0.0243) | <2e-16*** | 0.2274 (0.0238) | <2e-16*** | −0.1374 (0.0268) | 2.96e-07*** |
| Size: Medium | 0.0784 (0.0202) | 0.0001*** | 0.0769 (0.0158) | 1.14e-06*** | 0.1652 (0.0178) | <2e-16*** |
| Size: Large | 0.0201 (0.0293) | 0.4928 | 0.1276 (0.0211) | 1.53e-09*** | 0.1659 (0.0234) | 1.42e-12*** |
| Sector: Services | 0.0248 (0.0179) | 0.1661 | −0.0879 (0.0141) | 4.60e-10*** | −0.1031 (0.0158) | 7.20e-11*** |
| Part of Larger Conglomerate | −0.0703 (0.0259) | 0.0066** | 0.1009 (0.0182) | 3.10e-08*** | 0.0562 (0.0197) | 0.0043** |
| Female Ownership | 0.0795 (0.0216) | 0.0002*** | −0.0590 (0.0164) | 0.0003*** | 0.0768 (0.0170) | 6.42e-06*** |
| Log Sales | 0.0232 (0.0037) | 1.92e-10*** | 0.0651 (0.0030) | <2e-16*** | 0.0306 (0.0032) | <2e-16*** |
| Smooth Components (edf; χ²; p-value) | ||||||
| s(Years of Operation) | edf=3.820; χ²=7.75; p=0.118 | edf=4.232; χ²=44.43; p=2.54e-08*** | edf=1.095; χ²=3.79; p=0.054 | |||
| s(Legal Status) | edf=4.308; χ²=115.23; p<2e-16*** | edf=4.532; χ²=101.19; p<2e-16*** | edf=4.947; χ²=118.49; p<2e-16*** | |||
| s(Managerial Experience) | edf=6.535; χ²=93.87; p<2e-16*** | edf=1.000; χ²=67.71; p<2e-16*** | edf=2.809; χ²=9.52; p=0.029* | |||
| s(% Senior Mgt. Time Gov. Reg.) | edf=7.904; χ²=91.29; p=1.12e-15*** | edf=6.760; χ²=25.80; p=0.0013** | edf=8.244; χ²=161.23; p<2e-16*** | |||
| s(Region) | edf=4.971; χ²=1032.18; p<2e-16*** | edf=4.974; χ²=1112.02; p<2e-16*** | edf=4.973; χ²=678.03; p<2e-16*** | |||
| Correlation Parameters | ||||||
| θ₁₂ (Chk. vs. Overdraft) | 0.374 (95% CI: 0.353, 0.389) | |||||
| θ₁₃ (Chk. vs. Credit/Loan) | 0.204 (95% CI: 0.184, 0.234) | |||||
| θ₂₃ (Overdraft vs. Credit/Loan) | 0.302 (95% CI: 0.283, 0.316) |
4.5 Graphical Analyses
The graphical results from the full model provide visual insights into smooth functions of quantitative drivers and spatial heterogeneities in qualitative control factors.
Figure 3: Smooth Functions of Quantitative Drivers
The 3×3 grid of smooth function plots displays effects for years of operation, managerial experience, and percentage of senior management time on government regulations across the three outcome equations (checking/savings account ownership, overdraft facility, line of credit/loan). For years of operation, the overdraft facility equation shows a nonlinear increase peaking around 20–30 years before plateauing. Managerial experience shows a pronounced nonlinear effect on checking/savings account ownership (peak around 20 years), a linear effect on overdraft facility, and a weaker effect on credit line access. Regulatory compliance time displays complex nonlinear patterns, with credit line access increasing sharply beyond 20% (Wojtyś et al., 2018).
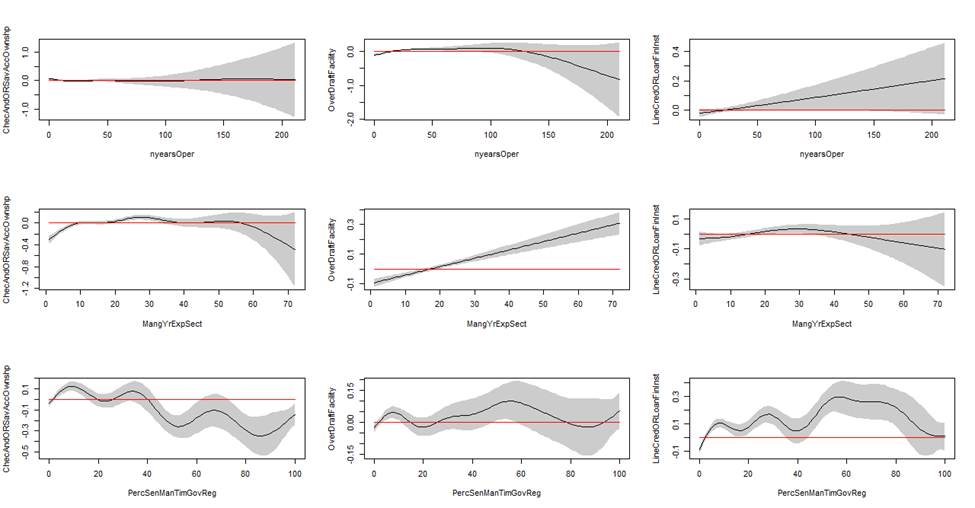
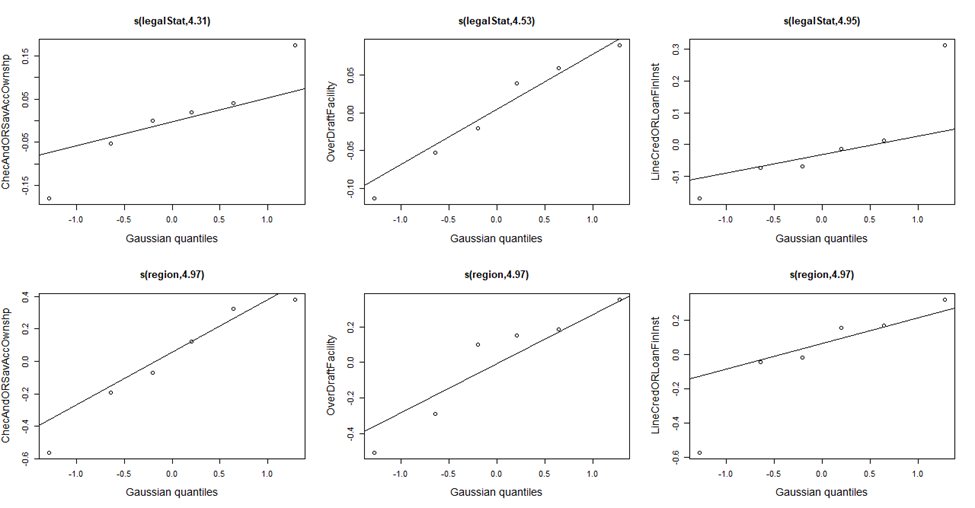
Figure 4: Smooth Functions of Qualitative Drivers (Spatial Heterogeneities)
The 2×3 grid maps smooth functions of legal status and region across the three equations. For legal status, sole proprietorships and limited partnerships show lower propensities for financial inclusion and credit access compared to shareholding firms (edf: 4.308–4.947, p < 2 \times 10^{-16}). Regional effects are highly significant (edf: 4.971–4.974, p < 2 \times 10^{-16}), with South Asia and Europe/Central Asia showing higher propensities for checking/savings account ownership and overdraft facility adoption, while Latin America and the Caribbean exhibit higher credit line access.
5. Implications
5.1 Theoretical Implications
The findings extend Signaling Theory by demonstrating that FFI, digital strategies, and external validations (certifications, auditing) serve as credible signals of creditworthiness in open banking contexts (Spence, 1973). The nonlinear effects of years of operation and managerial experience support Complexity Theory, highlighting the dynamic interplay of firm maturity and expertise (Anderson, 1999). The trivariate model’s correlation parameters (\theta_{12}=0.374, \theta_{13}=0.204, \theta_{23}=0.302) validate Random Utility Theory, capturing interdependent financial decisions (McFadden, 1974). These insights enrich the theoretical understanding of how firms navigate financial ecosystems under digital transformation.
5.2 Practical Implications
For firms, adopting digital strategies (websites and email) and securing quality certifications or external audits can enhance credit access by 3–12%. SMEs should prioritize FFI to leverage open banking benefits, particularly in mandatory regimes. Fintechs and banks can develop API-driven platforms to streamline credit evaluations, reducing costs by up to 25% (Gogia & Rastogi, 2022). Training programs for digital literacy and governance practices can further support SMEs, especially in emerging economies.
5.3 Policy and Sustainable Development Implications
Policymakers should promote mandatory open banking frameworks to enhance overdraft access, as evidenced by the 12% effect from the full model. Regulatory principles-based approaches, boosting credit line access by 25.2 percentage points, are suitable for fostering long-term financing. Aligning open banking with digital infrastructure investments can address regional disparities, particularly in Africa and the Middle East. Policies incentivizing certifications and audits can reduce information asymmetries, supporting SME financing.
The study aligns with SDGs 8 and 9. By increasing credit access, FFI promotes decent work and economic growth (SDG 8), potentially creating 12% more jobs (Brixiová et al., 2020). Enhanced digital and financial infrastructure supports industry, innovation, and infrastructure (SDG 9), as open banking reduces credit evaluation time significantly (Dhanorkar et al., 2025).
6. Conclusions and Future Research
This study demonstrates that FFI significantly enhances firms’ access to operational credit facilities in the open banking era, increasing overdraft and credit line access by 12.5% and 7.5%, respectively. Digital strategies amplify these effects by up to 12%, while quality certifications and external auditing contribute 3–5%. Mandatory open banking boosts overdraft access, and regulatory principles enhance credit lines. Firm size, sector, legal status, and regional factors moderate outcomes, with nonlinear effects of firm age and managerial experience. The trivariate probit model addresses endogeneity and interdependencies, offering robust insights.
The study’s reliance on WBES data up to 2023 may need actualization for more recent trends in digitalization and AI development. The model assumes uniform open banking implementation across regions, potentially oversimplifying regulatory variations. Unobserved factors, such as cultural attitudes toward credit, may influence results.
Future studies should use more recent data to validate findings, particularly post-2023 WBES datasets. Exploring the role of AI-driven credit scoring in open banking could extend these results (Sadok et al., 2022). Longitudinal designs can assess causal impacts over time, and qualitative studies can uncover firm-level strategies for leveraging open banking. Investigating cultural and behavioral factors in credit access could further enrich the literature.
The transformative potential of FFI and open banking lies in their ability to democratize credit access, fostering SME growth and economic resilience. As digital ecosystems evolve, integrating governance practices and regulatory frameworks will be key to realizing inclusive financial systems, aligning with global sustainability goals.
Declarations
- Funding: Not applicable.
- Conflict of interest: The authors declare no competing interests.
- Ethics approval: Not applicable.
- Data availability: The data used in this research is available upon reasonable request from the World Bank Enterprise Surveys.
- Code availability: R code is available upon reasonable request.
- Author contributions: I. Niankara: conceptualization, methodology, analysis, writing. A. Qasim, R. Muqattash, M. Sharairi: review and editing.
References
Aduda, J., & Obondy, S. (2021). Credit risk management and efficiency of savings and credit cooperative societies: A review of literature. Journal of Applied Finance and Banking, 11(1), 99–120.
Akerlof, G. A. (1970). The market for "lemons": Quality uncertainty and the market mechanism. Quarterly Journal of Economics, 84(3), 488–500. https://doi.org/10.2307/1879431
Anderson, P. (1999). Complexity theory and organization science. Organization Science, 10(3), 216–232. https://doi.org/10.1287/orsc.10.3.216
Awaworyi Churchill, S., & Smyth, R. (2020). Ethnic diversity, energy poverty and the mediating role of trust: Evidence from household panel data for australia. Energy Economics, 86, 104663. https://doi.org/10.1016/j.eneco.2019.104663
Beck, T., Demirgüç-Kunt, A., & Maksimovic, V. (2008). Financing patterns around the world: Are small firms different? Journal of Financial Economics, 89(3), 467–487. https://doi.org/10.1016/j.jfineco.2007.10.005
Bianco, M., & Vangelisti, M. I. (2022). Open banking and financial inclusion 54. European Economy, (1), 81–97.
Brixiová, Z., Kangoye, T., & Yogo, T. U. (2020). Access to finance among small and medium-sized enterprises and job creation in africa. Structural Change and Economic Dynamics, 55, 177–189. https://doi.org/10.1016/j.strueco.2020.08.008
Buckley, R. P., Arner, D. W., Zetzsche, D. A., & Selga, E. (2021). FinTech, financial inclusion, and sustainable development. Journal of Financial Regulation, 7(1), 1–23. https://doi.org/10.1093/jfr/fjaa017
Carriere-Swallow, Y., Haksar, V., & Patnam, M. (2021). India’s approach to open banking: Some implications for financial inclusion. IMF Working Papers, 2021(046). https://doi.org/10.5089/9781513561912.001
Chen, K., Li, A., Si, Y., & Tian, G. (2025). Mandatory ESG disclosure and trade credit: International evidence. Asia Pacific Journal of Accounting and Economics.
Colangelo, G., & Khandelwal, P. (2025). The many shades of open banking: A comparative analysis of rationales and models. Internet Policy Review, 14(1).
Deku, S. Y., & Morris, D. (2025). Climate change and the rise of shadow banking: A global analysis. International Review of Financial Analysis, 104(Part A), 104275. https://doi.org/10.1016/j.irfa.2025.104275
Demirgüç-Kunt, A., Klapper, L., Singer, D., Ansar, S., & Hess, J. (2018). The global findex database 2017: Measuring financial inclusion and the fintech revolution. World Bank Publications. https://doi.org/10.1596/978-1-4648-1259-0
Deng, R. (2023). Digital transformation of commercial banks, monetary policy transmission efficiency and SME financing: Empirical evidence from the chinese market. Modern Economy, 14(7), 999–1028.
Dhanorkar, T., Kotapati, V. B. R., & Sethuraman, S. (2025). Programmable banking rails:: The next evolution of open banking APIs. Journal of Knowledge Learning and Science Technology ISSN: 2959-6386 (Online), 4(1), 121–129.
Gogia, S., & Rastogi, S. (2022). Open banking and SME financing: Opportunities and challenges. Journal of Banking & Finance, 142, 106567. https://doi.org/10.1016/j.jbankfin.2022.106567
Gopalan, R., Song, F., & Yerramilli, V. (2020). Debt maturity and financial inclusion: Evidence from indian SMEs. Review of Financial Studies, 33(8), 3745–3786. https://doi.org/10.1093/rfs/hhz098
Hussain, S., Rehman, A. ur, Ullah, S., Waheed, A., & Hassan, S. (2024). Financial inclusion and economic growth: Comparative panel evidence from developed and developing asian countries. Sage Open, 14(1), 21582440241232585.
International Finance Corporation. (2023). SME finance gap: Assessment of the shortfalls and opportunities in financing micro, small, and medium enterprises in emerging markets. https://www.ifc.org/sme-finance-gap
Kadam, P., & Bandyopadhyay, S. (2024). Financial inclusion for marginalized entrepreneurs in india: Challenges and opportunities. Journal of Small Business Management, 62(3), 1456–1480. https://doi.org/10.1080/00472778.2023.2193456
Kede Ndouna, V. Y., & Nembot Ndeffo, L. (2023). Financial inclusion and business formalization in cameroon. African Development Review, 35(3), 267–289. https://doi.org/10.1111/1467-8268.12678
Kowalewski, O., & Pisany, P. (2022). The rise of fintech: A cross-country perspective. Management Science, 68(12), 8437–8458. https://doi.org/10.1287/mnsc.2022.4401
Liu, T., He, G., & Turvey, C. G. (2021). Inclusive finance, farm households entrepreneurship, and inclusive rural transformation in rural poverty-stricken areas in china. Emerging Markets Finance and Trade, 57(7), 1929–1958. https://doi.org/10.1080/1540496X.2019.1698426
Liu, X., & Zhao, Q. (2024). Banking competition, credit financing and the efficiency of corporate technology innovation. International Review of Financial Analysis, 94, 103248. https://doi.org/10.1016/j.irfa.2024.103248
Martı́nez-Sola, C., Mol-Gómez-Vázquez, A., & Hernández-Cánovas, G. (2024). Lines of credit and vulnerability during the financial crisis: A survival analysis for european SMEs. Applied Economics, 1–13.
McFadden, D. (1974). Conditional logit analysis of qualitative choice behavior. Frontiers in Econometrics, 105–142.
Mohamed, H. A. (2023). The role of digital transformation in the socio-economic recovery post COVID-19. Applied Economics, 55(32), 3716–3727.
Niankara, I. (2023). The impact of financial inclusion on digital payment solution uptake within the gulf cooperation council economies. International Journal of Innovation Studies, 7(1), 1–17. https://doi.org/10.1016/j.ijis.2022.08.003
Niankara, I. (2024). Evaluating the influence of digital strategy on the interplay between quality certification and sales performance using data science and machine learning algorithms. Journal of Open Innovation: Technology, Market, and Complexity, 10(3), 100354. https://doi.org/10.3390/joitmc10030100
Niankara, I., Hassan, H. I., Traoret, R. I., & Islam, A. R. M. (2025). Consumer savings and digital remittance in open banking: Insights from bibliometric and geospatial econometric analysis. Human Behavior and Emerging Technologies, 2025(1), 9352257.
Niankara, I., & Muqattash, R. (2020). The impact of financial inclusion on consumers saving and borrowing behaviours: A retrospective cross-sectional evidence from the UAE and the USA. International Journal of Economics and Business Research, 20(2), 217–242. https://doi.org/10.1504/IJEBR.2020.109432
Nizam, R., Abdul Karim, Z., Sarmidi, T., & Abdul Rahman, A. (2020). Financial inclusion and firms growth in manufacturing sector: A threshold regression analysis in selected ASEAN countries. Economies, 8(4), 80. https://doi.org/10.3390/economies8040080
Norden, L., & Ribeiro, T. (2025). Local credit in brazil: The role of digital connectivity and education. Emerging Markets Review, 65, 101265. https://doi.org/10.1016/j.ememar.2024.101265
Omarini, A. E. et al. (2018). Banks and FinTechs: How to develop a digital open banking approach for the bank’s future. International Business Research, 11(9), 23–36.
Perrin, C., & Weill, L. (2022). No man, no cry? Gender equality and financial inclusion around the world. Journal of Economic Behavior & Organization, 194, 366–378. https://doi.org/10.1016/j.jebo.2021.12.013
Sadok, H., Sakka, F., & El Maknouzi, M. (2022). Artificial intelligence and bank credit analysis: A review. Cogent Economics & Finance, 10(1), 2023262. https://doi.org/10.1080/23322039.2021.2023262
Shihadeh, F. H. (2018). How individual’s characteristics influence financial inclusion: Evidence from MENAP countries. International Journal of Islamic and Middle Eastern Finance and Management, 11(4), 589–606. https://doi.org/10.1108/IMEFM-05-2017-0122
Spence, M. (1973). Job market signaling. Quarterly Journal of Economics, 87(3), 355–374. https://doi.org/10.2307/1882010
Srivastava, A. (2025). Creditor rights and innovation: Evidence from a quasi-natural experiment. Journal of Contemporary Accounting and Economics, 21(3), 100496.
Stefanelli, V., & Manta, F. (2023). Digital financial services and open banking innovation: Are banks becoming “invisible”? Global Business Review, 09721509231151491. https://doi.org/10.1177/09721509231151491
Stiglitz, J. E., & Weiss, A. (1981). Credit rationing in markets with imperfect information. American Economic Review, 71(3), 393–410.
Takasu, Y. (2021). Relationships among earnings quality, bank monitoring, and cost of bank loans: Evidence from japan. International Journal of Economics and Accounting, 10(2), 204–230.
Tongurai, J., & Vithessonthi, C. (2018). The impact of the banking sector on economic structure and growth. International Review of Financial Analysis, 56, 193–207. https://doi.org/10.1016/j.irfa.2018.01.002
Tsou, H. T., & Chen, J. S. (2023). How does digital technology usage benefit firm performance? Digital transformation strategy and organisational innovation as mediators. Technology Analysis & Strategic Management, 35(9), 1114–1127. https://doi.org/10.1080/09537325.2021.1991575
Wahlström, G. (2022). The use of multidimensional information in credit decisions: A study from the inside of a successful bank. International Journal of Economics and Accounting, 11(2), 135–154.
Wang, L., Huang, Z., Wang, Y., & Yang, Y. (2025). Digital transformation in banking: Curbing procyclical leverage to strengthen financial stability. International Review of Financial Analysis, 103, 104205. https://doi.org/10.1016/j.irfa.2025.104205
Wang, Y., Song, X., & Zhou, J. (2025). Does firms’ digitalization affect trade credit provision? Asia Pacific Journal of Accounting and Economics, 32(2), 329–357.
Weber, R., & Musshoff, O. (2013). Can flexible microfinance loans improve credit access for farmers? Agricultural Finance Review, 73(2), 255–271. https://doi.org/10.1108/AFR-09-2012-0048
Wojtyś, M., Marra, G., & Radice, R. (2018). Copula based generalized additive models for location, scale and shape with non-random sample selection. Computational Statistics & Data Analysis, 127, 1–14. https://doi.org/10.1016/j.csda.2018.05.007
World Bank. (2024). Enterprise surveys (2006–2023): Data release july 2024. https://www.enterprisesurveys.org
Xinyao, D. et al. (2025). A study of the impact of digital financial inclusion on the performance of small and medium enterprises (SMEs). Academic Journal of Business & Management, 7(1), 1–12.
Zhen, X., & Zhou, Y. (2025). Digital transformation and corporate creditworthiness. Finance Research Letters, 74, 106742. https://doi.org/10.1016/j.frl.2024.106742