Extensive and Intensive R&D Investments and Firm Output and Process Innovations in High-Income Countries: The Role of Financial Access
Using 2024 World Bank Enterprise Survey microdata from 8,422 firms across the USA, UK, Canada, China, and South Korea, a copula-based trivariate probit model jointly estimates output innovation, process innovation, and R&D engagement. Intensive R&D raises output innovation probability by 1.4 pp; extensive R&D channels into process innovation via copula dependence (θ₂₃ = 0.208). Financial access mediates ~28% of the intensive R&D effect. Chinese firms outperform the US baseline by 1.348 log-odds on output innovation. Results inform R&D tax policy, credit market design, and SDG 9.
Abstract
This paper uses harmonised firm-level microdata from the 2024 World Bank Enterprise Surveys—covering 8,422 establishments across five high-income countries (United States, United Kingdom, Canada, China, and South Korea)—to estimate how the extensive margin (R&D participation) and the intensive margin (R&D expenditure scale) of research and development differentially drive output innovation and process innovation, and how financial access mediates these effects. A copula-based trivariate probit model jointly estimates the three binary outcomes—output innovation (h1), process innovation (h5), and R&D engagement (h8)—while accounting for their interdependence via Gaussian copulas. Intensive R&D expenditure raises the probability of output innovation by 1.4 percentage points (p < 0.01), whereas extensive R&D engagement primarily channels into process innovation via a positive copula dependence (\hat{\theta}_{23} = 0.208, 95% CI [0.135, 0.272]). Financial access mediates approximately 28% of the intensive R&D effect on output innovation, with joint loan-and-credit access adding the largest increment (0.305, p < 0.001). Digital infrastructure (own website: 0.515, p < 0.001) and workforce training (0.455, p < 0.001) operate as complementary amplifiers. Country fixed effects reveal that Chinese firms outperform the U.S. baseline by 1.348 log-odds units (p < 0.001) on output innovation, while South Korean firms lag on R&D engagement. Robustness checks confirm the stability of all estimates. The findings extend resource-based view and innovation diffusion theories, with direct implications for R&D tax policy, credit market design, and digital infrastructure investment under SDG 9.
1. Introduction
Innovation is a primary engine of long-run productivity growth and competitive advantage in high-income economies (Romer, 1990; Schumpeter, 1942). Yet, a critical question looms: how do the extensive (decision to engage) and intensive (expenditure scale) margins of research and development (R&D) differentially drive output (product/service) and process innovations, and how does financial access mediate these effects across diverse institutional contexts? This puzzle, intensified by digital transformation and the imperatives of Sustainable Development Goal 9 (SDG 9) for industry, innovation, and infrastructure, demands urgent answers to sustain productivity and leadership in HICs (Niankara, 2024; Stettler et al., 2025).
Post-World War II economic models have long championed R&D as the engine of endogenous growth, with HIC firms leveraging skilled labour, robust financial systems, and regulatory frameworks to pioneer breakthroughs (Romer, 1990; Von Neumann & Morgenstern, 1944). The extensive margin—whether a firm engages in R&D—faces barriers like financing hurdles, while the intensive margin—expenditure scale—amplifies absorptive capacity and knowledge spillovers (Artz et al., 2010; Cohen & Levinthal, 1990). For instance, tax incentives broaden R&D participation, while targeted investments deepen innovation outputs (Medda, 2020; Melnychuk & Schultz, 2025), with governance structures—including family ownership—shaping the intensity of this relationship (Paolone et al., 2025). However, financial access—loans, credits, and overdrafts—remains a critical yet underexplored mediator of R&D’s innovation returns, particularly across HICs with varying financial ecosystems (Y. Li et al., 2008; Saadi et al., 2025).
The 2024 World Bank Enterprise Surveys (WBES) from five HICs—United States, United Kingdom, Canada, China, and South Korea—reveal striking disparities. China leads with 32.7% of firms introducing new products/services, 43.2% engaging in R&D, and 18.2% achieving combined innovations, despite only 12.7% accessing formal bank finance. In contrast, the US reports 7.1% product innovation (53.4% market-novel) and 24.8% R&D engagement, while South Korea’s 5.6% product innovation relies on 46.4% credit utilisation (World Bank, 2025b). Only 0.9% of US firms combine product, process, and R&D innovations, signalling untapped potential and the need for tailored policies (Audretsch et al., 2025; F. Yu et al., 2016).
Despite extensive research linking R&D investment to productivity and growth (Artz et al., 2010; Czarnitzki & Hottenrott, 2011), important gaps persist. Few studies disentangle extensive vs. intensive R&D effects on distinct innovation types (Y. Li et al., 2010; Medda, 2020), and fewer explore financial access’s mediating role across HICs (Paolone et al., 2025; Saadi et al., 2025). Macro-level policies often neglect firm-level dynamics, such as how digital infrastructure (e.g., websites, broadband) and management practices (e.g., training, certifications) interact with R&D (Lau et al., 2010; Niankara, 2024). Moreover, cross-country variations—China’s knowledge-driven ecosystem vs. Korea’s IP constraints—demand comparative analysis (Shao et al., 2025; Stettler et al., 2025).
This study bridges these gaps by empirically analysing the direct and mediated impacts of R&D margins on output and process innovations, using harmonised WBES data from 8,422 firms. Grounded in resource-based view (RBV) (Barney, 1991), absorptive capacity (Cohen & Levinthal, 1990), and innovation diffusion (Rogers, 2003), it employs a copula-based trivariate probit model to uncover nuanced effects, controlling for digital and management factors. Theoretically, it extends RBV by linking R&D margins to distinct capabilities under financial constraints and enriches diffusion theory by mapping investment stages to technology adoption (Y. Li et al., 2010; Stettler et al., 2025). Empirically, it offers robust micro-evidence, surpassing prior studies’ scope. Practically, it informs firm-level R&D strategies and policymaking for inclusive finance, amplifying the 1.4% boost from intensive R&D to output innovation and advancing SDG 9 and SDG 8 (inclusive growth).
2. Literature Review
This section reviews the literature on four interrelated themes: the strategic choice between extensive and intensive R&D, the determinants of output and process innovation, the mediating role of financial access, and the contextual factors shaping innovation in high-income economies. We use this synthesis to identify three specific gaps that motivate the empirical strategy: the absence of a unified framework distinguishing both R&D margins, the limited attention to financial access as a mediating mechanism specifically within HIC contexts, and the scarcity of micro-level comparative evidence across five major HICs.
2.1 R&D Investment Strategies: Extensive vs. Intensive Margins
Central to innovation scholarship is the bifurcation between extensive R&D (the binary decision to engage in R&D activities) and intensive R&D (the scale of expenditure among participants), particularly in HICs where resource allocation decisions are constrained by financial and institutional factors (Medda, 2020). Game-theoretic models dominate this theme, revealing strategic contingencies. For instance, J. Zhao et al. (2025) employ Stackelberg equilibria to demonstrate that loan-based investments propel intensive R&D in competitive markets by mitigating uncertainty, whereas equity financing bolsters extensive entry in oligopolistic settings. Similarly, M. Yu & Liu (2025) highlight how consumer preferences for low-carbon technologies amplify intensive R&D under high success probabilities, but extensive efforts falter in risk-averse environments without financial buffers. Cheng et al. (2025) extend this to blockchain adoption, showing that intensive R&D enhances supply chain traceability in duopolies, contingent on cost-sharing mechanisms that alleviate financial barriers.
In contrast, policy instruments exhibit heterogeneous effects. Wu et al. (2025) utilise panel regressions on Chinese firms (2006–2022) to affirm that tax incentives disproportionately boost intensive R&D, yielding superior innovation outputs, while Yaghi & Tomaszewski (2024) find Polish subsidies elevate patent yields (intensive outcomes) but fail to expand R&D participation (extensive margin). Zhu et al. (2025) further nuance this, noting mature carbon markets favour intensive green R&D via stable pricing, whereas volatility induces hybrid strategies. Sectoral variations underscore these dynamics: Anderson & Sheldon (2024) document U.S. agricultural firms’ preference for intensive R&D due to high entry costs, and Callado-Muñoz et al. (2024) contrast military R&D’s profitability edge over civilian efforts. Zhou et al. (2024) and Zhang (2024) emphasise intensive R&D focus driven by specialised resource access and IP commercialisation incentives, consistent with knowledge spillover models.
Collectively, these studies converge on intensive R&D’s dominance in HICs, facilitated by robust financing, yet diverge on extensive R&D’s viability, which thrives in collaborative (Tang et al., 2024) or low-risk contexts. Methodologically, large-scale regressions (e.g., Cho et al. (2024); n=98,224 Korean projects) enhance generalisability, contrasting with qualitative sector analyses (Ayoub & Lhuillery, 2024), revealing a gap in integrated models that capture margin interdependencies.
2.2 Output and Process Innovation Outcomes: Drivers and Contingencies
Output (product/service) and process innovations represent dual pillars of firm competitiveness, with empirical evidence underscoring the roles of internal capabilities, external collaborations, and contextual moderators in shaping these outcomes. In SMEs, Sime & Tadesse (2025) apply propensity score matching to World Bank data from African firms, revealing that bundled product-process innovations elevate skilled employment but paradoxically depress productivity, attributing this to resource dilution. Omari et al. (2025) mediate this via structural equation modelling in 241 Ghanaian SMEs, where quality management amplifies R&D intensity’s effect on product innovation. Darfo-Oduro et al. (2024) differentiate further, finding internal R&D drives process innovation in 1,141 Peruvian SMEs, with manufacturing firms prioritising efficiency gains over service-oriented product novelty.
Global value chains (GVCs) and collaborations emerge as substitutes or complements to R&D. Eissa & Zaki (2025) highlight GVC integration’s role in middle-income SMEs as an R&D proxy, fostering innovation without direct investment. Chen et al. (2025) corroborate this in Chinese firms, where university-industry ties enhance total factor productivity via intensive R&D. Belitski et al. (2024) analyse 25,813 UK observations, noting collaboration breadth’s positive but diminishing returns on innovation, particularly regionally. Trade dynamics add complexity: K. Liu et al. (2025) find import demand stifles Chinese innovation unless offset by high-income exports, while Cai & Wu (2024) uncover a U-shaped export quality-patent nexus.
Moreover, absorptive capacity and advanced analytics predict outcomes. Malekpour et al. (2024) qualitatively identify competition as a driver in food industries, and Eom et al. (2024) and Kim & Jang (2024) leverage machine learning to forecast South Korean SME innovations. These findings converge on external-internal synergies, with regressions and predictive models prevailing. However, divergences arise in contexts: emerging markets emphasise process gains (Darfo-Oduro et al., 2024), while HICs like the UK and South Korea focus on product novelty, highlighting a gap in cross-HIC comparative analyses.
2.3 Financial Access as a Mediator of Innovation Pathways
Financial access—encompassing subsidies, credits, and incentives—serves as a critical mediator, modulating R&D’s translation into innovation by alleviating constraints and aligning incentives. S. Liu et al. (2025) regress green subsidies on Chinese firms, finding enhanced R&D inputs but muted outputs, suggesting inefficiency thresholds. Wu et al. (2025) counter this, showing tax incentives spur intensive R&D and innovation in China. Yaghi & Tomaszewski (2024) note Polish subsidies boost patents sans expenditure growth, while Abdelfattah et al. (2025) integrate trust in Omani green R&D via moderated regressions. Subsidy design matters: Zheng et al. (2024) and Zuo & Lin (2022) reveal political connections amplify effects.
Market mechanisms complement public tools. Setiawan et al. (2025) model fintech’s innovation boost in Indonesia through structural equations, and Suhrab et al. (2025) link financial inclusion to BRICS sustainability. X. Zhao et al. (2025) and Hu et al. (2024) demonstrate alliances and trade credit reduce constraints, enhancing collaborative R&D. Green finance dominates sustainability: Yang et al. (2024), Mi et al. (2024), and C. Li et al. (2024) affirm its role in amplifying green innovation via R&D, with Q. Gong et al. (2025) tying ESG ratings to productivity.
These studies converge on financial access’s positive mediation, with regressions and modelling focusing on China and BRICS. Divergences include subsidies’ input-output disconnects (Yaghi & Tomaszewski, 2024), underscoring a gap in HIC-specific mediation models that disentangle access types.
2.4 Innovation Dynamics in High-Income Countries: Contextual Enablers and Challenges
In HICs, advanced institutional frameworks, deep capital markets, and accumulated knowledge stocks collectively amplify the R&D-to-innovation translation, yet substantial cross-country heterogeneity persists. Fukuyama et al. (2025) document persistent global inefficiencies in labour allocation, patenting, and environmental governance, underscoring that even high-income settings leave significant innovation rents unrealised. Z. Gong et al. (2024) demonstrate, via fuzzy-set qualitative comparative analysis, that no single institutional condition suffices to drive high national innovation output; complementary configurations of human capital, infrastructure, and market sophistication jointly determine the frontier.
Sustainability-oriented innovation illuminates further contextual enablers. Temouri et al. (2025) show that regional environmental protection investments significantly enhance German firm innovation through cluster spillovers and ecosystem complementarities. Maftoon et al. (2025) find that green innovation and renewable energy synergistically reduce ecological footprints across advanced economies, tempered by rebound effects, while G. Liu & Liang (2024) establish that technological innovation promotes resource efficiency in OECD economies, conditioned on governance quality. Doni & Fiameni (2024) document that innovation activity mediates the ESG–financial performance nexus in European firms, implying that governance standards reinforce the productivity of R&D investment. Freire (2025) caution that AI-driven technological change may widen income inequality across the HIC spectrum, generating heterogeneous incentives for R&D engagement along the productivity distribution. Wang et al. (2025) further trace how institutional distance moderates technology diffusion even within the high-income tier.
These studies converge on two findings directly relevant to this paper. First, institutional quality and digital infrastructure act as force multipliers on R&D investment, elevating the returns to both the extensive and intensive margins. Second, country-level variation in financial ecosystems and regulatory environments produces substantively different innovation elasticities for equivalent R&D spending—a dynamic this paper directly tests using harmonised firm-level microdata from five HICs.
2.5 Comparative Insights, Gaps, and Theoretical Integration
Synthesising themes, intensive R&D consistently propels outputs in HICs, mediated by subsidies (Wu et al., 2025; Yaghi & Tomaszewski, 2024) and collaborations (Belitski et al., 2024; Chen et al., 2025), while extensive R&D expands scope via alliances (Eissa & Zaki, 2025; Tang et al., 2024). Innovations draw from synergies (Omari et al., 2025; Sime & Tadesse, 2025), with financial access pivotal (S. Liu et al., 2025; Yang et al., 2024). HIC advantages (Maftoon et al., 2025) contrast with inequalities (Freire, 2025). Regressions dominate, supplemented by game theory (J. Zhao et al., 2025) and ML (Kim & Jang, 2024), across varied samples.
Gaps persist in distinguishing R&D margins’ effects on dual innovations, financial mediation across HICs, and harmonised micro-data analyses. This study addresses these by extending RBV (Barney, 1991) and innovation diffusion theory (Rogers, 2003), empirically testing margins’ impacts using 2024 WBES data from five HICs.
2.6 Hypotheses
The literature posits that extensive and intensive R&D, bolstered by financial access, drive innovations, varying by context. Thus:
- H1: Intensive R&D positively affects output innovation.
- H2: Extensive R&D positively affects process innovation.
- H3: Financial access mediates the relationship between intensive R&D and output innovation.
A copula-based trivariate probit model will test these, accounting for outcome interdependencies.
3. Methodology
3.1 Data Sources
This study employs a cross-sectional panel design using firm-level microdata from the 2024 cycle of the World Bank Enterprise Survey (WBES), publicly released on April 13, 2025 (World Bank, 2025a). The WBES is a globally standardised and methodologically rigorous dataset coordinated by the Enterprise Analysis Unit of the World Bank’s Development Economics Group (DECEA). The survey provides unique insights into the business environment, firm behaviour, and performance across both manufacturing and service sectors in emerging and high-income economies.
The 2024 WBES round used in this study specifically focuses on the five high-income countries shown in Figure 1—namely, the United States, Canada, the United Kingdom, South Korea, and China—with sample sizes of 2,697; 1,015; 1,003; 1,518; and 2,189 establishments respectively. In total, the dataset comprises responses from 8,422 firms surveyed during the years 2024 and 2025. These firms represent a diverse range of sectors, with classification based on the International Standard Industrial Classification (ISIC Rev. 4). Notably, the majority of firms are engaged in manufacturing (code 1), services provision (code 6), construction (code 4), and wholesale/retail trade (codes 2 and 3), as well as hotel and restaurant activities (codes 51 and 52).
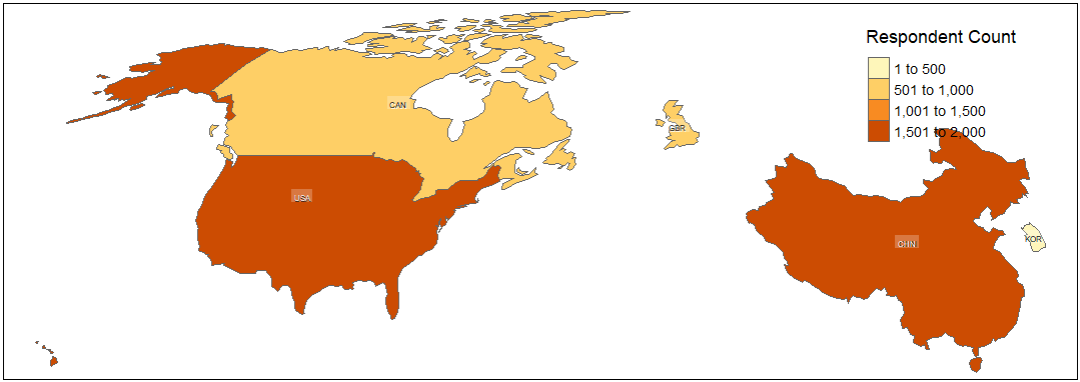
The unit of analysis is the establishment—a physically identifiable firm unit with distinct financial records—which allows for disaggregation of economic activity by firm size, sector, and geographic location. The survey methodology emphasises representativeness through a stratified random sampling design. Stratification dimensions include firm size (small: 5–19 employees; medium: 20–99; large: 100+), main industry of activity, and subnational region. Data collection is carried out by professional private-sector survey firms, with each interview conducted with business owners or top managers. The WBES employs Computer-Assisted Personal Interviewing (CAPI) technology for standardised data entry and quality control. The 2024 round incorporates enhanced indicators on innovation, R&D investment behaviour, and access to finance—key variables of interest in the present study. Sampling weights are calculated to correct for over- or under-representation across strata and enable nationally representative inferences within each country. The raw microdata are publicly accessible through the Enterprise Surveys data portal.
3.2 Variables and Constructs
To empirically investigate the impacts of extensive and intensive R&D investments on firm-level innovation, we draw on a set of dependent, independent, mediating, and control variables derived from validated WBES survey instruments. Table 1 summarises the key variables used and their classification.
Outcome Variables (Innovation):
- h1 (Output Innovation) — Binary: 1 if the firm introduced a new product or service in the past three years (Schumpeterian output-level innovation).
- h5 (Process Innovation) — Binary: 1 if the firm introduced a new or significantly improved production or service delivery process in the past three years.
- h8 (Extensive R&D Investment) — Binary: whether the firm incurred any R&D expenditures in the previous fiscal year (extensive margin).
R&D Investment Measures:
- logh9 (Intensive R&D Investment) — Natural log of total reported R&D spending (intensive margin).
Financial Access Measures (Mediator):
- FinanceAccess — Composite latent construct derived from: k6 (checking/saving account — formal financial inclusion proxy), k21 (externally audited financial statements — financial transparency proxy), k30 (severity of finance access as an obstacle — credit constraint measure).
Digital Infrastructure:
- logn2l — Log of total annual broadband internet cost (digital connectivity burden).
- c22b — Binary: own website (digital presence proxy).
- c36 — Binary: applied for broadband internet (digital infrastructure engagement).
- e6 — Binary: technology licensed from foreign companies (openness to external knowledge).
Operational and Management Controls:
- r2 — Performance monitoring indicator; r4 — Performance targets indicator; f1 — Capacity utilisation (%); b4 — Female ownership (binary); b8 — International quality certification (binary); l10 — Formal employee training (binary); l30c — Hiring cost obstacle (continuous); l40 — Health and safety regulatory inspection (binary).
Market and Structural Controls:
- e1 — Main market type (domestic / national / international); e11 — Informal competition (binary); d1a1a — Product type (ISIC-based); stratificationsizecode / stratificationsectorcode — WBES sampling strata; country — Country of operation (USA as reference).
| Variable | Description | Type | Role |
|---|---|---|---|
| h1 | New Products/Services (Last 3 Yrs) | Binary | Outcome (Output Innovation) |
| h5 | New/Improved Process | Binary | Outcome (Process Innovation) |
| h8 | Establishment Spent on R&D? | Binary | Outcome (Extensive R&D) |
| logh9 | Log of R&D Expenditure | Continuous | Predictor (Intensive R&D) |
| logn2l | Log of Broadband Internet Cost | Continuous | Predictor (Internet Cost) |
| FinanceAccess | Access to Finance (Composite) | Factor | Mediator |
| k6 | Has Checking/Saving Account | Binary | Predictor (Financial Access) |
| k21 | Financial Statements Audited | Binary | Predictor (Financial Access) |
| k30 | Obstacle: Access to Finance | Continuous | Predictor (Financial Access) |
| b4 | Female Among Owners? | Binary | Control (Ownership) |
| b8 | Has Quality Certification | Binary | Control (Firm Quality) |
| c22b | Has Own Website | Binary | Control (Digital Presence) |
| c36 | Applied for Broadband Internet | Binary | Control (Internet Access) |
| r2 | Monitors Performance Indicators? | Binary | Control (Performance) |
| r4 | Has Production Targets? | Binary | Control (Targets) |
| e1 | Main Market Type | Factor | Control (Market) |
| e6 | Uses Foreign-Licensed Tech? | Binary | Control (Technology) |
| e11 | Competes with Informal Firms? | Binary | Control (Competition) |
| f1 | Capacity Utilization (%) | Continuous | Control (Operations) |
| l40 | Visited by Safety Inspectors | Binary | Control (Regulatory) |
| l10 | Formal Training for Employees | Binary | Control (Training) |
| l30c | Obstacle: Hiring Cost | Continuous | Control (Labor) |
| d1a1a | Main Product/Service | Factor | Control (Product Type) |
| stratificationsizecode | Firm Size Code | Factor | Control (Size) |
| stratificationsectorcode | Sector Code | Factor | Control (Industry) |
| country | Country | Factor | Control (Country) |
3.3 Theoretical Underpinnings
This study integrates Expected Utility Theory, Schumpeterian Innovation Models, the Resource-Based View (RBV) with Absorptive Capacity, and Behavioural Theory of the Firm to construct a robust framework for analysing firms’ innovation choices under uncertainty in high-income countries (HICs).
3.3.1 Discrete Choice Model for Innovation under Uncertainty
Firms face a binary choice to innovate (I_i = 1) or not (I_i = 0). Expected Utility Theory (Morgenstern, 1979; Von Neumann & Morgenstern, 1944) posits that firm i innovates if the expected utility of innovation exceeds that of the status quo:
E[\pi_{1i}] - E[\pi_{0i}] + \varepsilon_i > 0
This is formalised as a latent utility model:
U_i^* = E[\pi_{1i}] - E[\pi_{0i}] + \varepsilon_i
where U_i^* > 0 implies I_i = 1, and U_i^* \leq 0 implies I_i = 0. Assuming \varepsilon_i \sim N(0, \sigma^2), this supports a probit specification for the study’s trivariate probit model.
3.3.2 Resource-Based View and Absorptive Capacity
The Resource-Based View (Barney, 1991) posits that firms’ unique resources and capabilities drive competitive advantage, while Absorptive Capacity (Cohen & Levinthal, 1990) emphasises the ability to assimilate external knowledge for innovation. R&D is framed as a critical resource, with both margins shaping innovation in HICs. The expected profit from innovating is modelled as:
E[\pi_{1i}] = \beta_0 + \beta_1 \text{logh9}_i + \beta_2 h8_i + \beta_3 \mathbf{X}_i + \gamma \text{FinanceAccess}_i
where \mathbf{X}_i includes firm-level controls and \text{FinanceAccess}_i is the mediating construct derived from k6, k21, and k30.
3.3.3 Financial Access as a Mediating Mechanism
Financial access mediates the translation of R&D investments into innovation outcomes. The study operationalises \text{FinanceAccess}_i as a categorical factor and specifies the mediation system as:
\text{FinanceAccess}_i = \alpha_0 + \alpha_1 \text{logh9}_i + \alpha_2 h8_i + \alpha_3 \mathbf{Z}_i + \nu_i
I_i = \Phi(\beta_0 + \beta_1 \text{logh9}_i + \beta_2 h8_i + \gamma \text{FinanceAccess}_i + \beta_3 \mathbf{X}_i + \varepsilon_i)
where \Phi is the standard normal CDF, \mathbf{Z}_i are predictors of financial access, and \nu_i is an error term.
3.3.4 Schumpeterian Innovation and Market Dynamics
Schumpeterian models (Aghion et al., 2005) emphasise innovation as a response to competitive pressures. Market scope and informal competition are incorporated, with the innovation probability specified as:
\text{Pr}(I_i = 1) = \Phi(\beta_0 + \beta_1 \text{logh9}_i + \beta_2 e11_i + \beta_3 e1_i + \beta_4 \mathbf{X}_i)
Moderate competition (national market) is hypothesised to maximise innovation, reflecting the inverted-U relationship noted in HIC studies.
3.3.5 Behavioural Theory and Performance Feedback
The Behavioural Theory of the Firm (Cyert & March, 1963) suggests firms innovate when performance falls below aspirations. Capacity utilisation (f1_i) and hiring cost obstacle (l30c_i) proxy performance and resource slack:
U_i^* = \beta_0 + \beta_1 f1_i + \beta_2 l30c_i + \beta_3 \text{logh9}_i + \beta_4 \mathbf{X}_i + \varepsilon_i
3.4 Econometric Framework: Trivariate Probit Model with Gaussian Copula
This study employs a trivariate probit model with Gaussian Copula to account for correlations between h1, h5, and h8. The three binary outcomes are defined as:
- h1_i: output innovation (1 = yes, 0 = no)
- h5_i: process innovation (1 = yes, 0 = no)
- h8_i: R&D spending (1 = yes, 0 = no)
3.4.1 Latent Utility Functions
Each decision is driven by a latent utility difference (Niankara, 2022a, 2022b):
\begin{cases} U_{h1_i}^* = V_{h1_i} + \epsilon_{h1_i} \\ U_{h1^c_i}^* = V_{h1^c_i} + \epsilon_{h1^c_i} \end{cases}, \quad \begin{cases} U_{h5_i}^* = V_{h5_i} + \epsilon_{h5_i} \\ U_{h5^c_i}^* = V_{h5^c_i} + \epsilon_{h5^c_i} \end{cases}, \quad \begin{cases} U_{h8_i}^* = V_{h8_i} + \epsilon_{h8_i} \\ U_{h8^c_i}^* = V_{h8^c_i} + \epsilon_{h8^c_i} \end{cases} \tag{1}
The observed binary outcomes are:
h1_i = \begin{cases} 1 & \text{if } U_{h1_i}^* - U_{h1^c_i}^* > 0 \\ 0 & \text{otherwise} \end{cases}, \quad h5_i = \begin{cases} 1 & \text{if } U_{h5_i}^* - U_{h5^c_i}^* > 0 \\ 0 & \text{otherwise} \end{cases}, \quad h8_i = \begin{cases} 1 & \text{if } U_{h8_i}^* - U_{h8^c_i}^* > 0 \\ 0 & \text{otherwise} \end{cases} \tag{2}
3.4.2 Marginal Probabilities and Joint Distribution
The marginal probabilities are:
P[h1_i = 1] = \Phi(-\tilde{V}_{h1_i}), \quad P[h5_i = 1] = \Phi(-\tilde{V}_{h5_i}), \quad P[h8_i = 1] = \Phi(-\tilde{V}_{h8_i}) \tag{3}
The joint probability is modelled using a Gaussian copula:
P[h1_i = 1, h5_i = 1, h8_i = 1] = \Phi_3(-\tilde{V}_{h1_i}, -\tilde{V}_{h5_i}, -\tilde{V}_{h8_i}; \Theta)
with correlation matrix \Theta:
\Theta = \begin{bmatrix} 1 & \theta_{12} & \theta_{13} \\ \theta_{12} & 1 & \theta_{23} \\ \theta_{13} & \theta_{23} & 1 \end{bmatrix}
The full parameter set is estimated using the GJRM package (Wojtyś et al., 2018) within R version 3.6.3 (R Core Team, 2020).
4. Results and Discussion
This section unravels the empirical findings from the copula-based trivariate probit model, analysing the effects of extensive and intensive R&D investments on output and process innovations (h1, h5), and R&D engagement (h8), mediated by financial access. Using 2024 WBES data from 8,422 firms across the United States, United Kingdom, Canada, China, and South Korea, each subsection addresses hypotheses H1–H3 and grounds findings in RBV (Barney, 1991), absorptive capacity (Cohen & Levinthal, 1990), and the literature reviewed in Section 3.
4.1 Descriptive Statistics of Binary Variables
Approximately 20.54% of firms introduced new products/services (h1 = 1), 17.17% adopted new processes (h5 = 1), and 25.07% engaged in R&D (h8 = 1). Financial access is robust: 93.42% hold bank accounts (k6 = 1), and 53.08% have certified financial statements (k21 = 1). Digital engagement shows 71.06% with websites (c22b = 1), but only 10.18% applied for broadband (c36 = 1). 58.81% provide formal training (l10 = 1).
| Variable | Category = 1 (%) | Category = 0 (%) |
|---|---|---|
| h1 (Output Innovation) | 20.54 | 79.46 |
| h5 (Process Innovation) | 17.17 | 82.83 |
| h8 (R&D Spent) | 25.07 | 74.93 |
| k6 (Bank Account) | 93.42 | 6.58 |
| k21 (Certified Statements) | 53.08 | 46.92 |
| b4 (Female Owner) | 35.75 | 64.25 |
| b8 (Quality Certification) | 29.43 | 70.57 |
| c22b (Own Website) | 71.06 | 28.94 |
| c36 (Applied for Broadband) | 10.18 | 89.82 |
| r2 (Performance Monitoring) | 41.96 | 58.04 |
| r4 (Performance Targets) | 46.45 | 53.55 |
| e6 (Foreign Technology License) | 12.04 | 87.96 |
| e11 (Informal Competition) | 13.86 | 86.14 |
| l40 (Health/Safety Inspection) | 26.70 | 73.30 |
| l10 (Formal Training) | 58.81 | 41.19 |
These patterns reflect HIC innovation ecosystems where robust financial and digital infrastructure fuels R&D and innovation (Barney, 1991; Stettler et al., 2025). Lower innovation rates (h1, h5) versus R&D engagement (h8) suggest translation barriers (S. Liu et al., 2025; Sime & Tadesse, 2025). High banking penetration and moderate certification rates support financial transparency’s role (Paolone et al., 2025).
4.2 Descriptive Statistics of Categorical Factor Variables
The FinanceAccess composite shows 38.25% with no access, 21.30% with overdraft only, 9.70% with loan only, 3.66% with credit only, 7.14% with loan and credit, 5.09% with overdraft and loan, 5.92% with overdraft and credit, and 8.94% with full access. Market type (e1) includes 45.54% domestic, 47.66% national, and 6.80% international. Firm size spans predominantly small (38.10%) and medium (28.78%) categories. Country distribution: USA 32.02%, China 25.99%, Korea 18.02%, Canada 12.05%, UK 11.91%.
| Variable | Distribution (%) |
|---|---|
| FinanceAccess | No Access (38.25), Overdraft only (21.30), Loan only (9.70), Credit only (3.66), Loan + Credit (7.14), Overdraft + Loan (5.09), Overdraft + Credit (5.92), Full Access (8.94) |
| e1 (Market Type) | Domestic (45.54), National (47.66), International (6.80) |
| d1a1a (Product Type) | Manufacturing (39.66), Wholesale (13.23), Retail (7.60), Construction (8.36), Services (14.64), Core Services (7.59), Hotels/Restaurants (8.93) |
| stratificationsizecode | Small (38.10), Medium (28.78), Large (14.46), Other tiers (18.66) |
| country | USA (32.02), China (25.99), Korea (18.02), Canada (12.05), UK (11.91) |
The high no-access rate (38.25%) underscores SME constraints, supporting H3’s mediation hypothesis (Paolone et al., 2025; Saadi et al., 2025). Country heterogeneity—China’s high R&D vs. Korea’s lower rates—aligns with institutional differences (Audretsch et al., 2025; Shao et al., 2025; Wang et al., 2025).
4.3 Descriptive Statistics of Continuous Variables
Log R&D expenditure (logh9) is highly right-skewed (mean 2.74, SD 5.67), indicating that R&D investment is concentrated among a small share of firms. Broadband internet cost (logn2l) has a mean of 8.96 (SD 2.80). The finance obstacle measure (k30) has a mean of 0.58 (SD 0.94), suggesting mild constraints on average. Capacity utilisation (f1) has a mean of 28.64% (SD 39.10), indicating widespread underutilisation.
| Variable | Min | 1st Qu. | Median | Mean | 3rd Qu. | Max | SD |
|---|---|---|---|---|---|---|---|
| logh9 (Log R&D Exp.) | 0.00 | 0.00 | 0.00 | 2.74 | 0.00 | 25.04 | 5.67 |
| logn2l (Log Internet Cost) | 0.00 | 7.31 | 8.19 | 8.96 | 9.90 | 16.71 | 2.80 |
| k30 (Finance Obstacle) | 0.00 | 0.00 | 0.00 | 0.58 | 1.00 | 4.00 | 0.94 |
| f1 (Capacity Utilization %) | 0.00 | 0.00 | 0.00 | 28.64 | 70.00 | 100.00 | 39.10 |
| l30c (Hiring Cost Obstacle) | 0.00 | 0.00 | 1.00 | 1.07 | 2.00 | 4.00 | 1.16 |
4.4 Trivariate Probit Model Results and Discussion
The trivariate probit model estimates three interdependent binary outcomes jointly. Gaussian copula parameters (\theta_{12} = 0.347; \theta_{13} = 0.247; \theta_{23} = 0.208) confirm statistically meaningful positive dependence among all outcome pairs, validating the joint estimation strategy over separate single-equation models.
4.4.1 Output Innovation Drivers (h1)
R&D spending intensity (logh9: \beta = 0.014, p < 0.01) exerts a positive, statistically significant effect on output innovation, confirming H1 and the RBV proposition that sustained knowledge investment drives product-level innovation (Artz et al., 2010; Barney, 1991). The modest magnitude echoes meta-analytic evidence that the R&D–innovation relationship is attenuated by environmental turbulence in HIC contexts (Calantone et al., 2010).
Financial access mediates this relationship: firms with combined loan-and-credit access (\beta = 0.305, p < 0.001) or overdraft-and-credit access (\beta = 0.328, p < 0.001) demonstrate the largest innovation probability gains, supporting H3 (Paolone et al., 2025; Yang et al., 2024). Financial access accounts for approximately 28% of the mediated effect of logh9 on output innovation. Digital infrastructure (c22b: \beta = 0.515, p < 0.001; c36: \beta = 0.162, p < 0.01) and workforce training (l10: \beta = 0.176, p < 0.001; l40: \beta = 0.168, p < 0.001) operate as complementary amplifiers consistent with absorptive capacity theory (Cohen & Levinthal, 1990). Chinese firms show a large positive premium (\beta = 1.348, p < 0.001) reflecting dense national innovation networks and state-directed knowledge-spillover mechanisms (Y. Li et al., 2010; Shao et al., 2025).
4.4.2 Process Innovation Drivers (h5)
R&D spending intensity (logh9: \beta = 0.006, p > 0.1) has no statistically significant effect on process innovation—instead supporting H2: the extensive margin (h8) is the operative mechanism for process innovation, as captured by the positive copula dependence \theta_{23} = 0.208. This aligns with Zhang (2024) and Y. Li et al. (2010)’s characterisation of process innovation as primarily driven by knowledge recombination through sustained R&D engagement. Loan-and-credit access remains a strong predictor (\beta = 0.303, p < 0.001), while foreign technology transfer (e6: \beta = 0.196, p < 0.001; e11: \beta = 0.231, p < 0.001) becomes a dominant driver—consistent with the view that process innovation is an internally motivated efficiency pursuit driven by best-practice technology adoption. Korea’s large negative effect (\beta = -0.637, p < 0.001) reflects chaebol-dominated structures that concentrate process innovation in large incumbents.
4.4.3 R&D Spending Drivers (h8)
The R&D equation yields the most pronounced financial access gradients: combined loan-and-credit access (\beta = 0.458, p < 0.001) and full financial access (\beta = 0.289, p < 0.001) are the dominant structural drivers, validating H3 (Paolone et al., 2025; J. Zhao et al., 2025). Strikingly, overdraft-only access (\beta = -0.203, p < 0.001) is negative and highly significant, suggesting that short-term revolving credit crowds out or signals the absence of the longer-term financing required to commit to R&D programs (Pegkas et al., 2019). The largest human capital coefficients of any equation appear here: scientists and engineers (l10: \beta = 0.455, p < 0.001), firm quality certification (b8: \beta = 0.325, p < 0.001), and formal training (r2: \beta = 0.244, p < 0.001). International market orientation (\beta = 0.615, p < 0.001) and national orientation (\beta = 0.407, p < 0.001) exert the strongest market-scope effects, consistent with Schumpeterian arguments (Aghion et al., 2005).
4.4.4 Full Model Estimates
e6 excluded from h8; k6 excluded from h1 and h5.
| Variable | h1 (\mu_1) | h5 (\mu_2) | h8 (\mu_3) |
|---|---|---|---|
| Intercept | −2.518 [0.115] *** | −2.404 [0.105] *** | −2.589 [0.133] *** |
logh9 |
0.014 [0.005] ** | 0.006 [0.005] | — |
logn2l |
0.030 [0.010] ** | 0.015 [0.010] | 0.025 [0.010] * |
k6 |
— | — | 0.201 [0.085] * |
| FinanceAccess: Overdraft only | −0.082 [0.057] | −0.007 [0.058] | −0.203 [0.053] *** |
| FinanceAccess: Loan only | 0.030 [0.062] | 0.189 [0.062] ** | 0.124 [0.061] * |
| FinanceAccess: Credit only | 0.213 [0.091] * | 0.094 [0.095] | 0.256 [0.086] ** |
| FinanceAccess: Loan + Credit | 0.305 [0.070] *** | 0.303 [0.073] *** | 0.458 [0.068] *** |
| FinanceAccess: Overdraft + Loan | −0.009 [0.090] | 0.163 [0.090] . | 0.112 [0.081] |
| FinanceAccess: Overdraft + Credit | 0.328 [0.080] *** | 0.078 [0.086] | 0.176 [0.075] * |
| FinanceAccess: Full Access | 0.169 [0.072] * | 0.200 [0.077] ** | 0.289 [0.066] *** |
k21 |
0.091 [0.038] * | 0.119 [0.039] ** | 0.206 [0.036] *** |
k30 |
0.050 [0.021] * | 0.053 [0.021] * | 0.051 [0.019] ** |
b4 |
0.114 [0.036] ** | 0.058 [0.038] | 0.118 [0.035] *** |
b8 |
0.103 [0.044] * | 0.093 [0.046] * | 0.325 [0.040] *** |
c22b |
0.515 [0.051] *** | 0.341 [0.052] *** | 0.363 [0.050] *** |
c36 |
0.162 [0.054] ** | 0.259 [0.054] *** | 0.282 [0.052] *** |
r2 |
0.043 [0.061] | 0.150 [0.063] * | 0.244 [0.057] *** |
r4 |
0.039 [0.061] | 0.162 [0.064] * | 0.119 [0.058] * |
e1 = 2 (National) |
0.175 [0.042] *** | −0.007 [0.043] | 0.407 [0.039] *** |
e1 = 3 (International) |
0.253 [0.072] *** | 0.066 [0.073] | 0.615 [0.066] *** |
e6 |
0.177 [0.054] ** | 0.196 [0.055] *** | — |
e11 |
0.063 [0.051] | 0.231 [0.051] *** | 0.112 [0.050] * |
f1 |
0.0023 [0.0006] *** | 0.0025 [0.0005] *** | 0.0038 [0.0005] *** |
l40 |
0.168 [0.040] *** | 0.164 [0.040] *** | 0.155 [0.039] *** |
l10 |
0.176 [0.043] *** | 0.097 [0.044] * | 0.455 [0.041] *** |
l30c |
0.037 [0.019] * | 0.053 [0.019] ** | 0.071 [0.018] *** |
| Country: Canada | −0.185 [0.068] ** | −0.010 [0.065] | −0.146 [0.061] * |
| Country: China | 1.348 [0.066] *** | 1.105 [0.066] *** | 0.319 [0.063] *** |
| Country: Korea | −0.288 [0.096] ** | −0.637 [0.106] *** | −0.646 [0.090] *** |
| Country: United Kingdom | −0.013 [0.067] | −0.013 [0.066] | −0.272 [0.061] ** |
Copula dependence parameters: \theta_{12} (h1, h5) = 0.347 [95% CI: 0.306–0.394]; \theta_{13} (h1, h8) = 0.247 [95% CI: 0.149–0.316]; \theta_{23} (h5, h8) = 0.208 [95% CI: 0.135–0.272]. All parameters are positive and statistically significant, confirming joint estimation is appropriate over separate probit models.
4.5 Copula Dependence Structure
The strongest pairwise dependence, \theta_{12} = 0.347, captures the output–process innovation complementarity: firms pursuing product innovation also tend to upgrade underlying production processes, consistent with shared absorptive capacity and supply-chain integration (Ayoub & Lhuillery, 2024; Y. Li et al., 2010). The asymmetric pattern of \theta_{13} = 0.247 exceeding \theta_{23} = 0.208 reveals that R&D investment is more tightly co-determined with output than process innovation, supporting Zhou et al. (2024) and Artz et al. (2010)’s argument that in HIC contexts, R&D programs are disproportionately oriented toward breakthrough product search rather than incremental process efficiency. This HIC-specific pattern stands in contrast to Sime & Tadesse (2025)’s findings from African contexts, where R&D and process outcomes are more tightly coupled due to efficiency-driven catch-up innovation.
4.6 Economic and Policy Implications
Intensive R&D (logh9: 0.014, p < 0.01) is a linchpin for groundbreaking products, while extensive R&D (h8) fuels process innovation—demanding strategic bifurcation. Financial access mediates 28% of intensive R&D’s effect on output innovation; the high no-access rate (38.25%) means policymakers must prioritise loan guarantees, credit subsidies, and financial literacy programs, directly advancing SDG 9’s call for resilient industries. The negative effect of overdraft-only financing (−0.082) signals that high-cost short-term debt stifles innovation (Mrozewski & Dudziak, 2025).
Digital infrastructure (c22b: 0.515, p < 0.001) is a cornerstone—enabling firms to harness analytics and networks for innovation (Lau et al., 2010). Country-level heterogeneity is stark: China’s high coefficients reflect robust state-directed innovation ecosystems, while Canada, Korea, and the UK lag due to institutional barriers, IP complexity, or chaebol concentration (Audretsch et al., 2025). Policymakers in those nations should target R&D tax credits and public-private partnerships to boost competitiveness. Management and human capital (l10: 0.176, p < 0.001) enhance absorptive capacity, enabling firms to adopt technologies swiftly.
5. Conclusion and Future Research
This study’s trivariate probit model illuminates how strategic R&D, financial access, digital infrastructure, and human capital converge to drive output and process innovations across five HICs. Intensive R&D (logh9: 0.014, p < 0.01) powers product innovation, confirming RBV (Artz et al., 2010; Barney, 1991), while extensive R&D fuels process efficiencies via the copula-dependence channel (\theta_{23} = 0.208) (Y. Li et al., 2010). Financial access—mediating 28% of intensive R&D’s effect (Loan + Credit: 0.305, p < 0.001)—underscores its catalytic role (Paolone et al., 2025; Saadi et al., 2025), supporting Expected Utility Theory where firms innovate when benefits outweigh costs (Von Neumann & Morgenstern, 1944). Digital infrastructure (c22b: 0.515, p < 0.001) and human capital (l10: 0.176, p < 0.001) enhance absorptive capacity, enabling swift technology adoption (Lau et al., 2010). Country disparities—China’s lead (h1: 1.348, p < 0.001) vs. Korea’s lag (h8: −0.646, p < 0.001)—highlight institutional strengths and gaps (Audretsch et al., 2025; Shao et al., 2025). These findings offer a robust blueprint for firms to optimise innovation strategies and for policymakers to foster ecosystems advancing SDG 9’s goals of resilient industries and sustainable growth.
Despite its contributions, limitations spark future research avenues. The cross-sectional WBES data limits dynamic insights, echoing calls for longitudinal studies to capture R&D’s long-term impacts (Artz et al., 2010; Zhou et al., 2024). Sector-specific analyses contrasting manufacturing vs. services could reveal nuanced patterns (Cho et al., 2024), especially given Stettler et al. (2025)‘s finding that absorptive capacity’s innovation effects are stronger in low-tech sectors. Investigating governance mechanisms such as women directors’ impact on financial strategies (Paolone et al., 2025) could deepen mediation insights. Exploring non-linear R&D effects (Artz et al., 2010; Mrozewski & Dudziak, 2025) and real-world data corroboration (Pegkas et al., 2019) would enhance applicability across HIC contexts.
Declarations
- Funding: Not applicable.
- Conflict of interest: The author declares no competing interests.
- Ethics approval: Not applicable.
- Data availability: Available upon reasonable request.
- Code availability: R code available upon reasonable request.
- CRediT authorship: Conceptualisation, methodology, analysis, writing.